
What’s the situation for global growth?
What to look out for today
Companies reporting on Wednesday, 15 April: Bank of America, Morgan Stanley
Key data to move markets today
EU: French CPI, Eurozone Industrial Production and speeches by Bank of Spain Governor José Luis Escrivá, ECB Executive Board members Piero Cipollone and Isabel Schnabel and ECB President Christine Lagarde
UK: A speech by BoE Governor Andrew Bailey
US: NY Empire State Manufacturing Index, Fed’s Beige Book and speeches by Fed Governor Michael Barr and Fed Vice-Chair for Supervision Michelle Bowman
GLOBAL: IMF and World Bank Spring Meeting
Global Macro Updates
IMF unveils several scenarios with less optimistic forecasts. The IMF’s latest World Economic Outlook has revised down its global growth projections, as previously indicated by Managing Director Kristalina Georgieva. The conventional baseline scenario is now referred to as a ‘reference forecast,’ reflecting the challenges of working with uncertain core assumptions amid ongoing developments in the Middle East. This scenario assumes that the conflict involving Iran will be relatively short-lived, with disruptions expected to subside by mid-2026.
Global growth is now forecast at 3.1% for 2026, a reduction of 0.2 percentage points, and 3.2% for 2027, unchanged from the prior forecast. Over the medium term, growth is expected to stabilise around 3.4%, in line with the momentum observed in 2024–2025, but notably softer than the 3.7% average recorded during the 2000s. Global inflation is projected at 4.4% in 2026. It is anticipated to decrease to 3.7% in 2027; both figures have been revised upward.
The report also includes alternative scenarios to account for a prolonged or escalating conflict. The first scenario considers larger and more persistent increases in energy prices, which would reduce global growth to 2.5% in 2026 and push inflation to 5.4%. The more severe scenario envisions extensive damage to energy infrastructure in the conflict region, resulting in growth of around 2% and inflation exceeding 6%.
The Outlook emphasises that downside risks predominate. Geopolitical uncertainty threatens to undermine positive drivers, including those led by advancements in artificial intelligence, which might have otherwise warranted an upgrade in global growth forecasts. The IMF cautions that a reassessment of anticipated profits from AI or heightened competition, which could curb markups, may lead to reduced investment and potentially trigger abrupt corrections in financial markets.
Policy recommendations within the report generally advocate for prudent and pragmatic approaches. The IMF urges central banks to remain vigilant against prolonged supply shocks that could destabilise inflation expectations. It recommends that central banks retain the flexibility to look through negative supply shocks, such as the present one, provided inflation expectations remain well anchored and monetary policy is appropriately calibrated.
In circumstances where there is an imminent risk of excessive or disorderly movements in exchange rates, temporary foreign exchange interventions and capital flow management measures may be necessary.
Prepared remarks from Managing Director Georgieva describe the current situation as a classic supply shock, noting that an adjustment in demand is inevitable. The report generally endorses a ‘wait-and-see’ approach for central banks, while emphasising the need for decisive rate hikes should inflation expectations become unanchored.
On fiscal policy, the IMF maintains a hawkish stance given the limited fiscal space available. The report cautions that attempts to suppress price signals could dampen the demand response, thereby contributing to higher global energy prices. Fiscal measures in response to negative demand shocks should be carefully calibrated and implemented only when there is sufficient fiscal headroom. Moreover, the IMF stresses that fiscal and monetary policies must be aligned and should not work at cross purposes.
US Stock Indices
Dow Jones Industrial Average +0.66%
Nasdaq 100 +1.81%
S&P 500 +1.18%, with 8 of the 11 sectors of the S&P 500 up
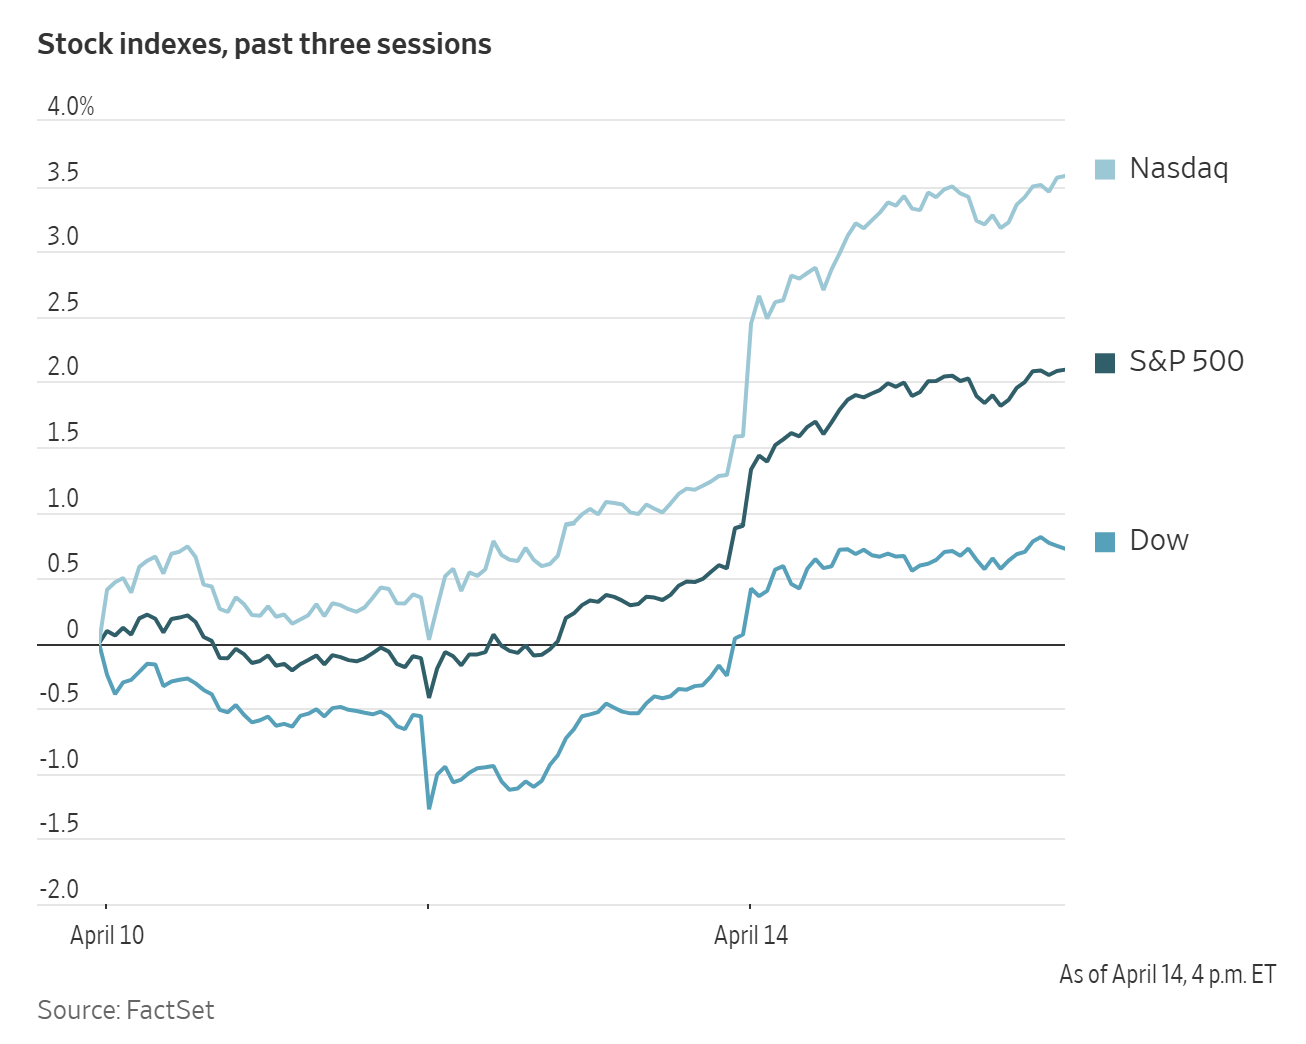
Despite the US blockade of the Strait of Hormuz, investors remained undeterred as stocks climbed on Tuesday. The Nasdaq gained +1.96%, marking its 10th consecutive rise; the S&P 500 increased +1.18% and is 0.2 percentage points close to a new record; the Dow rose by 317.74 points, or +0.66%.
In corporate news, LVMH Moet Hennessy Louis Vuitton, the largest luxury-goods company globally, reported disappointing sales and attributed this to the ongoing conflict in the Middle East.
United Airlines CEO, Scott Kirby, has suggested a possible merger with American Airlines, according to Bloomberg news.
BP expects strong results in oil trading for the first quarter due to rising prices from the Iran war but cautioned that increased volatility in energy markets might affect its overall performance.
S&P 500 Best performing sector
Communication Services +3.18%, with Meta Platforms +4.41%, Alphabet +3.56% and Netflix +3.56%
S&P 500 Worst performing sector
Energy -2.16%, with APA -6.23%, Occidental Petroleum -4.62% and Devon Energy -4.27%
Mega Caps
Alphabet +3.56%, Amazon +3.81%, Apple -0.14%, Meta Platforms +4.41%, Microsoft +2.27%, Nvidia +3.80% and Tesla +3.34%
Information Technology
Best performer: Micron Technology +9.17%
Worst performer: Akamai Technologies -6.43%
Materials and Mining
Best performer: Newmont +2.40%
Worst performer: Celanese -4.57%
Corporate Earnings Reports
Posted on Tuesday, 14 April from The Pulse, our real-time AI- driven news tool. Available exclusively on the EXANTE Web Platform
JPMorgan Chase: EPS $5.94 vs est $5.44-$5.36 beat. Adj revenue $50.54 bn vs est $49.26 bn beat. Managed NII $25.48 bn vs est $25.18 bn. FICC trading rev $7.08 bn vs est $6.65 bn. Equities trading $4.48 bn vs est $4.31 bn, deposits $2.68 tln vs est $2.58 tln, CET1 14.3%. Provision for credit losses $2.51 bn. FY NII guidance adjusted to ~$103 bn from prior ~$104.5 bn.
BlackRock: adj EPS $12.53 beating est $11.48. Revenue $6.70 bn beating $6.5 bn est. AUM $13.89 tln slightly missing $13.92 tln est. Net inflows $129.72 bn missing $146.33 bn est but featuring record $132 bn iShares ETF inflows and $135.90 bn long-term inflows. Base fees & securities lending revenue $5.44 bn beating $5.3 bn est. Over the past 12 months, $744 bn net new assets drove 10% organic base fee growth.
Johnson & Johnson: adj. EPS $2.70 beating est. $2.69, down from $2.77 YoY. Revenue of $24.06 bn beating est. $23.66 bn. Medtech sales $8.64 bn up 7.7% YoY. Tremfya revenue $1.61 bn beat est. $1.41 bn. Darzalex $3.96 bn beat est. $3.84 bn. Raised FY adj. EPS guidance to $11.45-$11.65 from $11.43-$11.63, adj. oper. EPS to $11.30-$11.50 from $11.28-$11.48 and sales to $100.3 bn - $101.3 bn from $100 bn - $101 bn.
Wells Fargo: EPS $1.60 beating $1.57, revenue $21.45 bn missing $21.76 bn estimate, net interest income $12.10 bn vs $12.27 bn est, average loans $996 bn beating $980 bn est, average deposits $1.42 tln beating $1.41 tln est. Provision for credit losses $1.14 bn vs $1.13 bn est. CEO highlighted 15% YoY diluted EPS growth, 6% revenue growth, 11% loan growth, 7% deposit growth.
European Stock Indices
CAC 40 +1.12%
DAX +1.27%
FTSE 100 +0.25%
Commodities
Gold spot +2.09% to $4,839.61 an ounce
Silver spot +5.23% to $79.53 an ounce
West Texas Intermediate -5.26% to $92.07 a barrel
Brent crude -3.00% to $95.15 a barrel
Gold prices advanced by more than two percent on Tuesday, buoyed by a weakening US dollar. Optimism surrounding the potential resumption of negotiations between the United States and Iran contributed to gains.
Spot gold increased +2.09%, closing at $4,839.61 per ounce.
The US dollar index declined -0.27% to 98.11. A softer US currency enhances the appeal of dollar-denominated bullion for investors holding other currencies.
Spot silver also advanced, rising +5.23% to $79.53 per ounce.
Oil prices declined on Tuesday as optimism grew regarding the potential resumption of negotiations between Iran, the US and Israel aimed at resolving the conflict that has resulted in the closure of the Strait of Hormuz.
Brent crude futures settled at $95.15 per barrel, reflecting a decrease of $2.94, or -3.00%. Meanwhile, US WTI crude closed at $92.07, down $5.11, or -5.26%.
Notably, both benchmarks had risen by more than two percent in the previous session following the US military's initiation of a blockade at Iranian ports.
Brent prices are particularly sensitive to global supply disruptions, whereas WTI prices primarily reflect domestic shipments within the United States as well as exports to Central and South America.
Although the prospect of renewed US - Iran talks exerted downward pressure on oil prices, this reaction overlooks the physical loss of oil barrels that are no longer being transported. According to the International Energy Agency's monthly report, attacks on energy infrastructure in the Middle East and Iran's effective closure of the Strait of Hormuz have created the largest oil supply disruption in history, with 10.1 million barrels per day lost in March.
On Monday, the US military announced that its blockade of the Strait of Hormuz would be extended eastward to the Gulf of Oman and the Arabian Sea. Ship-tracking data indicated that two vessels reversed course in the strait as the blockade commenced. However, three Iran-linked tankers entered the Gulf and were permitted to proceed, as their destinations were not Iranian ports, according to shipping data.
In response, Iran threatened to retaliate against the blockade by targeting ports in countries adjacent to the Gulf.
Meanwhile, sources indicated that negotiating teams from the United States and Iran may reconvene in Islamabad this week. A US official confirmed ongoing efforts to reach an agreement, while Pakistani Prime Minister Shehbaz Sharif stated that initiatives were continuing.
Note: As of 4 pm EDT 14 April 2026
Currencies
EUR +0.28% to $1.1788
GBP +0.47% to $1.3561
Bitcoin +1.48% to $74,205.19
Ethereum +3.26% to $2,324.64
The US dollar lingered near six-week lows on Wednesday, surrendering nearly all the gains it had made since the Middle East war erupted on 28 February as hopeful signs of another round of talks between the US and Iran ignited risk appetite.
The euro traded +0.28% higher to $1.1788, hovering near its highest since 2 March. Sterling was +0.47% higher at $1.3561. The dollar index was at 98.11, near its lowest in over six weeks after declining -0.27% on Tuesday.
The Japanese yen appreciated +0.36% to ¥158.77 per US dollar.
Fixed Income
US 10-year Bond -3.9 basis points to 4.254%
German 10-year Bund -7.6 basis points to 3.023%
UK 10-year gilt -7.2 basis points to 4.731%
US Treasuries exhibited modest gains across the curve on Tuesday, supported by optimism regarding a potential de-escalation of the Iran conflict. Despite this positive sentiment, trading activity remained subdued as investors consolidated their positions and awaited clearer indications on the resolution of hostilities.
In late trading, the yield on the 10-year Treasury declined -3.9 bps to 4.254%, while the 30-year yield fell -3.4 bps to 4.865%.
On the shorter end of the curve, the two-year yield, which reflects expectations for interest rates, dropped -2.8 bps to 3.755%.
Data indicating a lower-than-anticipated increase in US producer prices for March had minimal effect on Treasuries, as market participants remained primarily focussed on developments in the region and the timing of a possible cessation of hostilities.
The Producer Price Index (PPI) for final demand increased by 0.5% last month following a downwardly revised 0.5% rise in February. Economists had projected the PPI would accelerate by 1.1% after the previously reported 0.7% gain in February.
Over the 12 months through March, the PPI advanced by 4.0%, compared to a 3.4% rise in February.
The US yield curve flattened on Tuesday, with the spread between two-year and 10-year yields narrowing to 49.9 bps from 51.0 bps at the end of Monday’s session.
According to CME Group's FedWatch Tool, Fed funds futures traders are pricing in 9.8 bps of rate cuts in 2026, higher than the 2.4 bps priced in a week ago. Fed funds futures traders are now pricing in a 0.0% probability of a 25 bps rate hike at the 29 April FOMC meeting, compared to last week’s 2.1% probability.
Eurozone government bond yields declined on Tuesday, yet remained near 15-year highs. This movement was driven by increasing optimism over a potential resolution to the Middle East conflict, as well as remarks from ECB officials that tempered expectations for further rate hikes.
Germany’s 10-year government bond yield decreased -7.6 bps to 3.023%, while two-year yields, more responsive to anticipated policy changes, fell -10.3 bps to 2.545%.
Yields continued their downward trend in the afternoon session following comments by ECB President Christine Lagarde, who noted that the eurozone economy was positioned between the 'baseline' and 'adverse' scenarios outlined by the central bank last month.
The adverse scenario anticipates inflation rising to 3.5% in 2026, which is less severe than the 'severe' scenario, where inflation would surge to 4.4%.
Money markets forecast an ECB deposit facility rate of 2.59% by year-end, suggesting two rate hikes and approximately a 35% probability of a third increase, compared to around 2.70% late on Monday.
Additionally, markets indicated about a 30% chance of a rate hike in April, down from 50% on Monday. The current deposit facility rate stands at 2.0%.
Italian 10-year bond yields declined -8.4 bps to 3.802%. The yield premium of Italian government bonds over German Bunds was recorded at 77.9 bps.
Note: As of 4 pm EDT 14 April 2026
While every effort has been made to verify the accuracy of this information, EXT Ltd. (hereafter known as “EXANTE”) cannot accept any responsibility or liability for reliance by any person on this publication or any of the information, opinions, or conclusions contained in this publication. The findings and views expressed in this publication do not necessarily reflect the views of EXANTE. Any action taken upon the information contained in this publication is strictly at your own risk. EXANTE will not be liable for any loss or damage in connection with this publication.
This article is provided to you for informational purposes only and should not be regarded as an offer or solicitation of an offer to buy or sell any investments or related services that may be referenced here. Trading financial instruments involves significant risk of loss and may not be suitable for all investors. Past performance is not a reliable indicator of future performance.


Created by professionals. For professionals.
