
EXANTE Quarterly Macro Insights Q1 2026: Will global markets be fundamentally changed by the war?

Q1 review
In Q1 investors were focused on the AI boom. However, over the course of Q1, and particularly following the outbreak of the US-Israel-led war with Iran, global equities saw a rotation out of AI stocks. In the US, major indices had their worst quarter in nearly four years due to renewed geopolitical conflicts and inflation concerns: the S&P 500 was -4.63% in Q1 and the Nasdaq -5.98%.
European equities followed their US counterparts with the Stoxx 600 -1.53%, France’s CAC 40 -4.08%, and Germany's DAX -7.39%.
During Q1 government bond markets initially saw yield steepening, based on an assumption that rates would continue to fall in the US and UK, with the possibility of a further cut by the ECB later in 2026. However, this turned into yield compression as volatility rose and shorter duration bonds sold off on expectations of tighter monetary policy following the surge in oil prices that saw inflation forecasts rise.
US Indices for Q1 2026 and YTD
S&P 500 -4.63% Q1 and -3.95% YTD
Nasdaq 100 -5.98% Q1 and -4.87% YTD
Dow Jones Industrial Average -3.58% Q1 and -3.12% YTD
NYSE +0.39% Q1 and +0.80% YTD
According to the S&P Sector and Industry Indices, 6 of the 11 S&P 500 sectors were up in Q1. The best performing sector in Q1 was Energy at +37.24%, followed by Materials at +9.30%, and Utilities at +7.52%, whereas Financials was -9.80%, followed by Consumer Discretionary and Information Technology at -9.34% and -9.25%, respectively.
It was a decidedly negative Q1 for the Magnificent Seven: Nvidia -6.49%, Apple -6.65%, Alphabet -8.13%, Amazon -9.77%, Tesla -17.34%, Meta Platforms -13.33% and Microsoft -23.46%.
In Q1 Energy stocks were +37.24% and outperformed the S&P 500’s -4.63% due to supply constraints and infrastructure destruction due to the conflict in Iran. Occidental Petroleum was +58.07%, Marathon Petroleum +50.14%, and Phillips 66 +41.18%, ExxonMobil +40.98%, BP +40.09%, Halliburton +37.97%, Chevron +35.75%, Baker Hughes +34.06%, and Shell +30.77%.
Basic materials stocks were +9.30% in Q1. Performance was positive with CF Industries Holdings +67.88%, Yara International +36.23%, Albemarle Corporation +26.93%, Freeport-McMoRan was +15.73%, Newmont Mining +8.41%, Mosaic +5.85%, Nucor Corporation +3.67% while Sibanye Stillwater -15.64%.
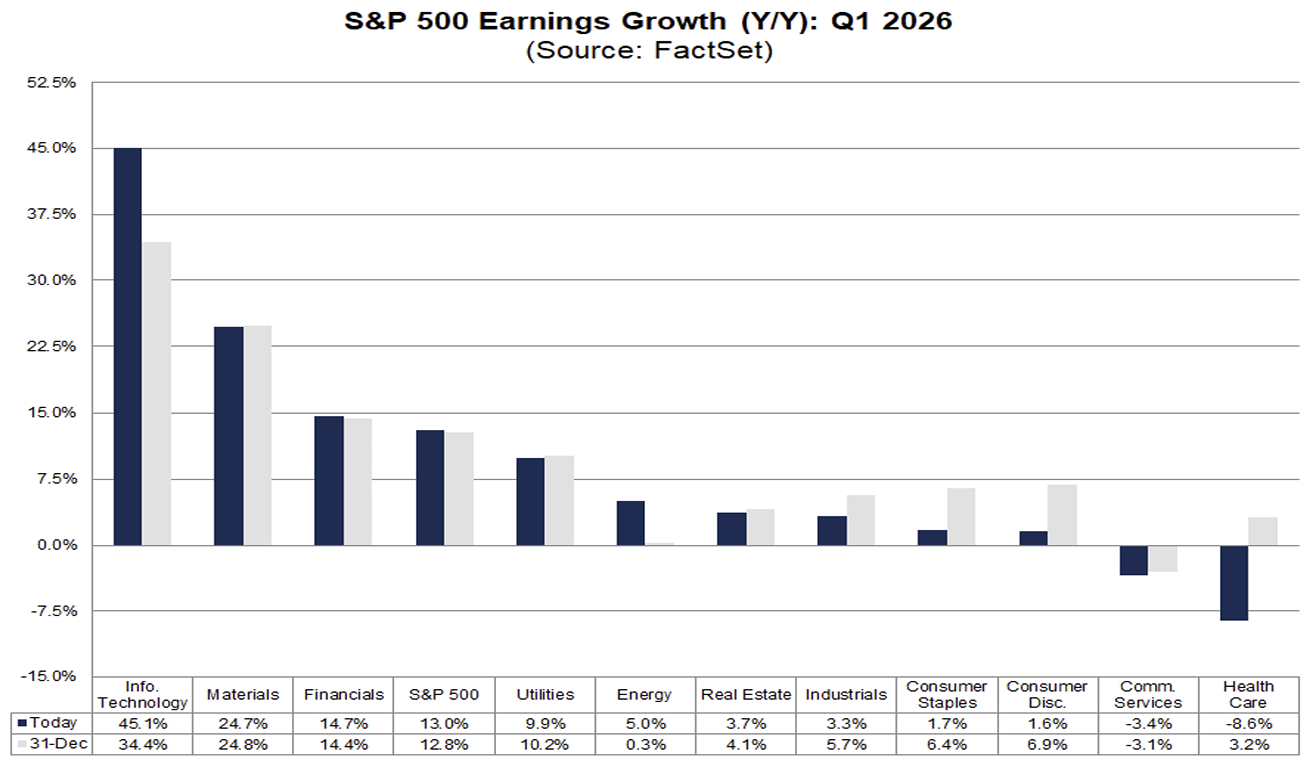
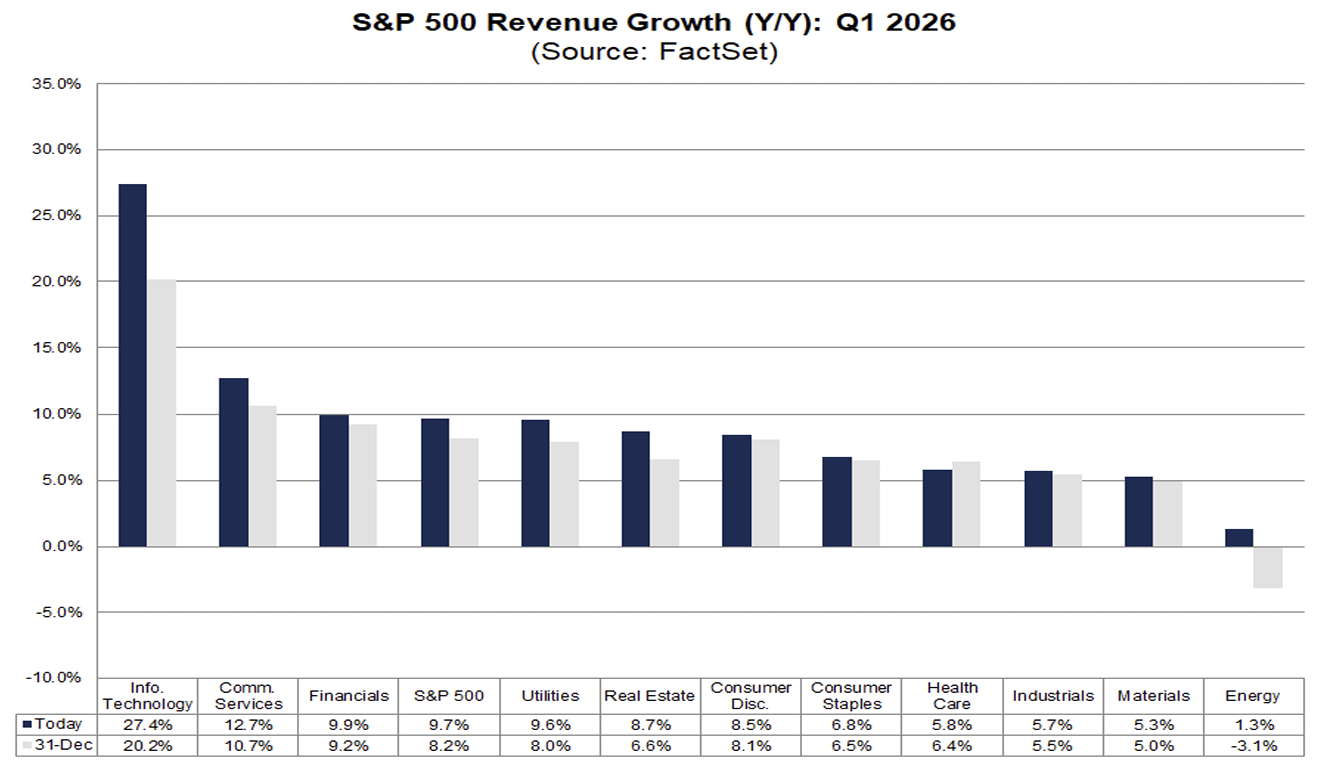
For Q1 2026, according to FactSet, the estimated y/o/y earnings growth rate is 13.0%.
The proportion of S&P 500 companies issuing positive EPS guidance is above historical averages. Of the 110 companies in the index that have provided guidance for Q1 2026 to date, 60 have issued positive EPS guidance, while 50 have issued negative guidance. The resulting rate of 54.5% for positive guidance is higher than both the 5-year average of 42.0% and the 10-year average of 40.0%.
The estimated net profit margin for the S&P 500 in Q1 2026 is 13.2%. This figure matches the net profit margin recorded in the previous quarter and surpasses both the margin from the same quarter last year, which was 12.8%, and the five-year average of 12.2%.
At the sector level, four sectors are forecast to achieve a y/o/y increase in net profit margins in Q1 2026 compared to the same period in 2025. Information Technology is expected to lead this growth, rising to 29.0% from 25.4%. Conversely, six sectors are anticipated to experience a y/o/y decline in net profit margins, with Communication Services showing the most pronounced decrease to 13.7% from 16.0%. The Utilities sector is projected to maintain its net profit margin unchanged at 14.6%, consistent with the previous year.
Six sectors are anticipated to report net profit margins for Q1 2026 that exceed their 5-year averages. Information Technology is expected to demonstrate the most significant increase, with a 4.0 percentage point difference, reaching 29.0% in Q1 2026 compared to its 5-year average of 25.0%.
Conversely, five sectors are projected to report Q1 2026 net profit margins below their respective 5-year averages. Real Estate is the most notable in this group, with an anticipated decrease of 2.3 percentage points, from 35.8% to 33.5%.
European Indices Q1 2026 and 2026 YTD
Stoxx 600 -1.53% Q1 and +0.93% YTD
DAX -7.39% Q1 and -4.87% YTD
CAC 40 -4.08% Q1 and -2.06% YTD
IBEX 35 -1.49% Q1 and +1.58% YTD
FTSE MIB -1.41% Q1 and +1.71% YTD
FTSE 100 +2.47% Q1 and +4.36% YTD
As of 26 March, according to LSEG I/B/E/S data for the Stoxx 600, Q4 2025 earnings are expected to decrease 2.0% from Q4 2024. Excluding the Energy sector, earnings are also expected to decrease 0.2%. Q4 2025 revenue is expected to decrease 4.6% from Q4 2024. Excluding the Energy sector, revenues are expected to decrease 3.2%. Of the 273 companies in the Stoxx 600 that reported earnings for Q4 2025 by 26 March, 54.6% reported results exceeding analyst estimates. In a typical quarter 54% beat analyst EPS estimates. Of the 348 companies in the Stoxx 600 that have reported revenue for Q4 2025, 55.2% reported revenue exceeding analyst estimates. In a typical quarter 58% beat analyst revenue estimates.
The Stoxx 600 expects to see share-weighted earnings of €132.1 billion in Q4 2025 compared to share-weighted earnings of €134.8 billion (based on the year-ago earnings of the current constituents) in Q4 2024. Companies are collectively reporting earnings that are 1.6% below estimates. This figure is lower than the long-term average surprise factor of 1.4% observed since 2012.
Two of the ten sectors in the index expect improved earnings compared to Q4 2024. At 27.9%, the Utilities sector has the highest earnings growth rate for the quarter, while Real Estate has the highest anticipated contraction of 343.5% compared to Q4 2024.
The forward four-quarter price-to-earnings ratio (P/E) for the Stoxx 600 sits at 14.3x. This is slightly above the 10-year average of 14.2x.
The Stoxx 600 is -2.09% since this earnings season began on 13th January.
Analysts anticipate positive Q4 earnings growth in six of the sixteen countries comprising the Stoxx 600 index. Austria, with an estimated growth rate of 118.9%, and Italy, at 19.5%, are projected to have the highest earnings growth, whereas Denmark and Ireland are expected to experience the most significant declines, estimated at -25.7% and -19.1%, respectively.
Global Indices for Q1 and 2026 YTD
Hang Seng -3.29% Q1 and -1.31% YTD
MSCI World -3.46% Q1 and -2.45% YTD
Fixed Income in Q1 and 2026 YTD
US Treasuries 10-year yield +15.1 bps Q1 and +15.0 bps YTD to 4.322%
Germany’s 10-year yield +16.6 bps Q1 and +12.8 bps YTD to 2.988%
Great Britain’s 10-year yield +36.8 bps Q1 and +29.7 bps YTD to 4.775%
Bonds were volatile throughout Q1 and sold off sharply following the outbreak of war with Iran as the surge in energy prices fuelled inflation concerns. Short-dated bonds were hit particularly hard as traders quickly shifted from pricing at least two rate cuts from the Fed this year, to openly questioning the possibility of rate hikes instead. The benchmark 10-year US Treasury yield moved +15.1 bps higher by the end of Q1. The two-year yield rose +31.8 basis points on expectations of Fed tightening, while the 30-year yield was up +6.4 bps.
Across the Atlantic, UK Gilts were the worst performers for the quarter, down about 2.0%. Prior to the outbreak of the war with Iran, Gilts had been the top global performer as continuing disinflation fuelled expectations of further rate cuts by the BoE. However, the surge in LNG prices throughout March has left the UK particularly vulnerable to inflationary pressures given the country’s relatively high dependence on natural gas. The BoE struck a decisively hawkish tone at its March meeting with unanimous vote on holding rates and by suggesting that it “stands ready to act as necessary”.
European government bonds mirrored their US counterparts over the quarter, also coming under pressure and underperforming. The ECB left rates unchanged at its March meeting, but strongly signalled the possibility of rate hikes. Its updated baseline projections already saw headline inflation hitting 2.6% year on year in 2026, even before accounting for the surge in energy prices in March.
Italian bonds emerged as the worst affected by the war in Q1 2026 due to its dependency on imported energy. The Italian sovereign bond market (BTPs) underperformed both Bunds and OATs.
The German 10-year yield +16.6 bps over Q1, while the 2-year Schatz advanced +50.0 bps. On the long end, the 30-year yield was -2.5 bps. Italy’s 10-year yields rose +36.2 bps to 3.912%, leaving the spread over Bunds at 90.2 bps, a widening of 21.6 bps through Q1. French 10-year yields +17.0 bps to 3.729%, consequently, the premium over Bunds increased by 2.4 bps through Q1 to 72.3 bps.
Commodities in Q1 and 2026 YTD
Gold spot +8.94% Q1 and +10.27% 2026 YTD to $4,757.30 an ounce
Silver spot +5.40% Q1 and +5.42% YTD to $75.12 an ounce
West Texas Intermediate crude +76.90% Q1 and +72.29% YTD to $98.91 a barrel
Brent crude +94.24% Q1 and +64.69% YTD to $100.31 a barrel
The first quarter of 2026 was one of the most consequential in recent memory for commodity markets. Gold extended its historic bull run to unprecedented levels, setting an all-time record before surrendering a portion of gains as the geopolitical backdrop shifted in late March. Oil, having been widely expected to face a year of gradual price erosion under the weight of ample supply, was instead jolted by the worst supply shock in nearly fifty years as the outbreak of war in the Middle East fundamentally altered the global energy equation.
Gold opened the year at $4,314.12 per troy ounce on 2 January, building from a year-end 2025 close that already represented a record level. Within three weeks, gold had added roughly 12%, briefly testing the $4,888 level as markets grappled with a confluence of supportive forces: the Fed's pause-versus-cut debate, geopolitical uncertainty stemming from the Trump administration's escalating rhetoric toward Iran, and persistent central bank accumulation. On 28 January — coinciding precisely with the FOMC's hold decision and its cautiously hawkish undertones — gold surged to an all-time high of $5,594.82 per troy ounce.
The drivers underpinning this extraordinary run were interconnected and self-reinforcing. Central bank demand remained a foundational pillar, with the World Gold Council forecasting approximately 850 tonnes of official-sector purchases in 2026, nearly matching the elevated pace of the prior year. A survey of central bank reserve managers indicated that 68% planned to increase gold holdings over the course of the year, with geopolitical uncertainty and the desire to diversify reserves away from dollar-denominated assets cited as primary motivations. However, central bank buying momentum eased at the very start of 2026, with net purchases of just 5 tonnes in January against a prior twelve-month monthly average of 27 tonnes, suggesting that some institutions paused in the face of elevated and volatile prices. ETF inflows and bar and coin demand remained robust alongside official-sector activity.
Gold consolidated around the $4,800 level in the initial weeks of February, as some profit-taking emerged following the January peak and the market awaited fresh catalysts. That changed definitively on 28 February. The launch of coordinated US-Israeli strikes on Iran and Iran's immediate declaration that the Strait of Hormuz was closed transformed the risk landscape overnight.
Yet even gold was not immune to the secondary effects of the shock. As the scale of the energy disruption became clear, markets began pricing in a sustained period of elevated inflation, reducing the probability of Fed rate cuts and strengthening the dollar, both factors that historically weigh on gold. The metal closed the quarter at $4,699.60 per troy ounce on 31 March, representing a decline of 16.00% from its January peak.
Gold was +8.94% in Q1 and is +10.27% for the year as safe haven demand amid geopolitical risk kept central banks, retailers and investors buying. Silver was +5.40% in Q1, after facing headwinds in March, but was ultimately supported by sustained demand by industrial producers, supply constraints, and strong inflows into silver ETFs as investors sought out safe havens.
For oil, the quarter unfolded in two entirely distinct phases. Through January and most of February, the market reflected the supply-heavy consensus that had characterised institutional forecasts heading into the year. Brent crude opened at $60.91 per barrel and WTI at $57.41, consistent with a broadly bearish outlook in which ample production from non-OPEC+ producers and OPEC+'s decision to hold output levels were seen as capping any sustained recovery.
The second phase began abruptly on 28 February. Within days of the Strait of Hormuz's effective closure, WTI surged 12.21% in a single session as traders processed the full implications of the disruption, a chokepoint through which approximately 20 million barrels per day, or roughly one-fifth of global petroleum consumption, had previously transited. The conflict, which the IEA described as the worst oil supply shock in history, rapidly extended to energy infrastructure across the broader Gulf region. On 13 March, US forces struck Kharg Island, Iran's principal oil export terminal, through which approximately 90% of Iranian crude exports passed, targeting missile and mine storage facilities in a strike that impaired over 90% of Iranian crude export capacity. The island, vital to Iran's economic architecture and handling upwards of 1.3 to 1.6 million barrels per day under normal conditions, became the central symbol of the supply disruption.
Investors should be under no illusion about the structural damage that has been inflicted. The repair timeline at Ras Laffan — measured in years, not months — means that the LNG supply shock will persist well beyond any near-term ceasefire. The physical rerouting of global tanker flows, the repricing of marine insurance, and the decisions by major shippers to suspend Gulf operations have introduced frictions that will not dissolve quickly even as geopolitical conditions evolve. The critical variables to monitor include the pace of Strait of Hormuz reopening, the IEA reserve release schedule, OPEC+ spare capacity deployment, particularly from Saudi Arabia and the UAE, and the trajectory of US shale production as the price incentive for incremental supply intensifies.
Note: Data as of 5 pm EST 1 April 2026
Regional news
The USA
The S&P 500 Index posted its worst quarter in Q1 since 2022. US economic data was already showing signs of weakness prior to the outbreak of the US-Israel-led war with Iran. The unemployment rate rose to 4.4%. However, ADP private sector employment increased by 66,000 jobs in February and by 62,000 in March. Education and health services were the highest contributors for both months. Wage growth held steady at 4.5%. On the growth front, business activity fell again in March with the March Flash S&P Global Composite PMI index falling to an 11-month low of 51.4, down from 51.9 in February due to a weaker upturn in new orders and spike in prices following the outbreak of war in the Middle East, as services sector activity fell. The Flash Services PMI came in at 51.1 from February’s 51.7, an 11-month low. The Flash Manufacturing PMI however was up, rising to 52.4 from February’s 51.6. Companies are stock building due to concerns that the war may lead to more protracted supply issues and price rises. Input costs have already reached a 10-month peak. Employment contracted for the first time in more than a year, as firms sought to reduce overheads amid heightened economic uncertainty. On the consumer side, US consumer confidence unexpectedly rose in March with the Conference Board’s index increasing to 91.8, from a revised 91 reading in February. The Present Situation Index increased by 4.6 points to 123.3, while the Expectations Index, based on consumers’ short-term outlook for income, business, and labour market conditions, declined by 1.7 points to 70.9. This surprise rise was in sharp contrast to the University of Michigan confidence survey which indicated that US consumer sentiment fell in March from February’s 56.4 to 55.5 with consumer sentiment dipping about 2%, reaching its lowest reading of the year. Inflation was 0.3% m/o/m in February. Core annualised CPI was +2.5% y/o/y and 0.3% m/o/m. However, the Fed's favoured inflation measure, the core PCE price index, was +3.1% in January and +0.4% m/o/m. In an 11-1 vote, the Fed voted for the second consecutive meeting to leave their benchmark lending rate at a range of 3.5%-3.75% in March. There is speculation the Iran war will deepen the economic slowdown, with Fed Chair Jerome Powell saying the central bank has little control over supply shocks. Although Fed policymakers have said that the US is still well-positioned to handle the energy price surge, others have acknowledged it will likely feed through to core inflation through items like airfares and other transportation costs.
The eurozone
The eurozone entered 2026 on a notably constructive footing, with European equity indices posting record highs in the opening days of January. The STOXX Europe 600 and MSCI Europe advanced between six and eight percent through February in euro terms, materially outperforming their US counterparts, a trend that reflected a structural re-rating of European assets long considered undervalued. Crucially, the eurozone economy had demonstrated greater resilience than expected in Q4 2025. Manufacturing orders in Germany had risen sharply in the final months of 2025, Q4 GDP printed at +0.3% q/o/q, and the infrastructure PMI was turning upward, fuelling optimism that fiscal stimulus would begin transmitting to the real economy in 2026.
The ECB held its key rates unchanged at both its February and March meetings, keeping the deposit facility rate at 2.0%. In February, the policy stance reflected growing confidence that inflation was converging toward the 2% target, with January's reading briefly falling to 1.7%. However, the escalation of conflict in the Middle East in late February abruptly shifted the calculus. By its March meeting, the ECB raised its 2026 inflation projection to 2.6% from 1.9% and acknowledged meaningful upside risks to prices and downside risks to growth, pushing markets, previously pricing in rate cuts, to begin contemplating the prospect of hikes instead.
The primary driver of equity outperformance through the first half of the quarter was the European defence and rearmament theme. Germany's 2026 federal budget allocated approximately €108 billion to defence, a 25% increase y/o/y, alongside a €500 billion federal investment programme targeting infrastructure, digital technology and energy. Defence stocks led the rally, with the Goldman Sachs Europe Defence basket up approximately eighteen percent through January. BAE Systems surged nearly six percent after reporting a stronger-than-expected rise in full-year operating profit, emblematic of the broader repricing underway in the sector. ASML also captured investor attention, rising seven percent in early January on renewed AI-related optimism, reinforcing the narrative that Europe's exposure to semiconductor capital equipment offered a distinct structural advantage. Basic resources, telecommunications, oil and gas, and utilities all added double-digit gains in the period, reflecting a broader rotation toward commodity exposure and defensive income.
March itself proved a severe interruption, as the Iran shock complicated the outlook significantly. Natural gas inventories in Europe were already at depleted seasonal levels going into the disruption, making the continent acutely sensitive to the loss of Qatari LNG capacity. The OECD accordingly revised the euro area's 2026 GDP growth projection down to 0.8%, with Germany at 0.8%, Italy at 0.4% and Spain at 2.1%. Investors should remain mindful of a delicate policy dilemma for the ECB: rate hikes to anchor inflation expectations risk amplifying the demand shock from higher energy costs, while premature cuts could allow medium-term inflation expectations to drift. The execution risk around Germany's ambitious defence spending ramp adds further nuance to the earnings outlook for industrials and defence contractors. For energy-intensive manufacturing and the consumer sector, the pass-through from sharply higher gas and oil prices will be a key earnings variable to track through the remainder of the year. The ECB's 29 April meeting will be closely watched for revised guidance on whether the current holding stance will be maintained in the face of what may prove to be a stagflationary impulse.
Performance across European equities was mostly negative in Q1. Unsurprisingly, Oil & Gas was the strongest performer, rising by +32.58%. The Stoxx Europe 600 was -1.53%, France’s CAC 40 -4.08%, and Germany's DAX -7.39%. In Q1, European equities underperformed their US counterparts.
In Q1 sector performance exhibited a distinct bias towards defensive sectors. Sector-wise, Stoxx Euro 600’s top performers included Oil & Gas +35.91%, Telecom +16.05%, Utilities +12.45%, Basic Resources +11.24%, and Chemicals +6.09%. Conversely, Personal & Household Goods -14.78%, Autos & Parts -14.06%, Travel & Leisure -12.92%, Retail -10.15%, and Financial Services -7.33% lagged behind.
The Granolas in Q1: GSK +13.13%, Roche -21.47%, ASML +21.47%, Nestlé -0.41%, Novartis +10.27%, Novo Nordisk -29.01%, L'Oréal -4.71%, LVMH -28.20%, AstraZeneca +6.53%, Sanofi +0.00%, and SAP -29.49%.
The UK
The UK began 2026 on a landmark note for its equity market. The FTSE 100 breached the 10,000-point threshold for the first time in January, cementing a 22% gain across 2025 that made it one of the top-performing indices globally, and one that, in a notable reversal of historical norms, outpaced the S&P 500. The structural composition of the index, heavily weighted toward commodity producers, energy majors, defence contractors and financials, had proven an advantage in an environment of sticky inflation, elevated commodity prices and rising defence budgets. Mining companies including Glencore, Rio Tinto and Antofagasta benefited from copper prices reaching record highs, while banking stocks delivered earnings momentum in early trading.
Monetary policy entered the quarter on a carefully calibrated easing path. The BoE held the Bank Rate at 3.75% at both its February and March meetings, though the tone across the two decisions differed markedly. In February, the MPC signalled that the restrictiveness of policy had declined materially following 150 bps of cuts since August 2024 and communicated that further reductions were likely, with CPI inflation on track to fall to approximately 2% from April aided by measures announced in the Budget 2025, including a reduction in the Ofgem household energy price cap. The March meeting brought a sharp reassessment. With the Middle East conflict already driving energy prices sharply higher, the MPC voted unanimously to hold, acknowledging that CPI inflation, previously projected at 2.1% in Q2, was now expected to remain between 3% and 3.5% through the coming quarters. The prospect of near-term rate cuts, which had appeared probable just weeks earlier, was effectively deferred.
The energy shock late in the quarter exposed the UK's vulnerability as a large net importer of fossil fuels. The OECD identified the UK as one of the most adversely affected advanced economies, revising its 2026 headline inflation projection upward by 1.5 percentage points to 4.0%, the largest such revision among major European peers. GDP growth for the year was cut to 0.7%, from a prior trajectory that UBS had estimated at 1.1% as recently as February. In equity markets, the divergence within the index became pronounced: energy stocks, with BP and Shell gaining on higher oil prices, and miners tracking commodity strength, partially offset weakness in banking, travel, leisure and domestic consumption-linked names. The travel and leisure sub-index was on track for double-digit monthly losses by March's end, as higher fuel costs and disrupted Middle Eastern flight routes weighed on earnings expectations.
Notable individual stories during the quarter included BAE Systems' strong profit report, which underlined the UK's growing role in the defence supply chain, and Rio Tinto's more challenging FY 2025 results, which saw net profit fall 14% due to higher depreciation, taxes and financing costs, serving as a reminder that commodity-sector earnings are not immune to cost inflation. Investors approaching the remainder of the year should weigh carefully the BoE's constrained position: with inflation re-accelerating and growth weakening simultaneously, the room for manoeuvre is narrow. The FTSE 100's commodity and energy bias offers a partial hedge against the supply shock, but domestic-facing sectors, including housebuilders, retailers and consumer services, face a difficult period of squeezed real incomes and subdued confidence.
Asia ex-Japan
The year opened with extraordinary momentum across Asian equity markets. The MSCI Emerging Markets Index delivered a return of 8.86% in January alone, against just 2.26% for the MSCI World, as a confluence of favourable conditions: a weaker US dollar, expectations of continued Fed easing, resilient earnings from technology exporters and improved investor positioning, created a compelling backdrop for the region. China was a dominant contributor to this strength, with AI-related stocks continuing to build on the wave of enthusiasm sparked by the emergence of DeepSeek in early 2025. Shanghai Biren Technology's debut on the Hong Kong Stock Exchange, where its shares surged nearly 120% on listing day, with the retail portion of the offering oversubscribed more than 230x, crystallised the scale of domestic appetite for Chinese AI hardware names.
South Korea and Taiwan also benefited from the AI-capex cycle, with technology exporters leveraged to semiconductor capital equipment and advanced memory chips enjoying strong earnings momentum as US and Chinese hyperscalers continued to signal aggressive CapEx guidance for 2026. India, meanwhile, carried solid economic fundamentals into the year, the RBI had delivered 125 bps of cumulative cuts in 2025, and GDP growth was tracking near 6.1% for 2026, supported by a recovery in urban consumption and improving credit conditions.
The outbreak of the Iran conflict on 28 February introduced a sharp fracture across the region. With over 80% of the oil and LNG transiting through the Strait of Hormuz destined for Asian markets, and China, India, Japan and South Korea collectively accounting for 75% of the oil and 59% of the LNG flows through the chokepoint, the region faced a supply shock of unusual severity. Iranian strikes forced the closure of Qatar's Ras Laffan LNG complex, the world's largest, removing approximately 12.8 million tonnes per year of export capacity, potentially for three to five years. This triggered sharp spikes in Asian spot LNG prices to their highest level in three years. South Korea's exposure was acute: the won fell to its weakest level since the global financial crisis of 2008, and the Bank of Korea (BoK) activated a round-the-clock crisis task force to manage financial stability risks. India implemented targeted energy rationing for industry. China moved quickly to bolster domestic supply and redirect Russian gas volumes, a measure of relative insulation that allowed Chinese equities to fall only 4.6% since the onset of the conflict, considerably less than the 10%-plus declines in Korean and Indian benchmarks.
By quarter-end, the MSCI Asia Pacific Index had erased all of its 2026 year-to-date gains, with Samsung Electronics and SK Hynix among the largest single-stock detractors. The quarter's narrative was thus one of sharp reversal: a region that entered 2026 with the strongest momentum in global equities found itself hosting some of the most acute energy vulnerabilities. Investors should be mindful that the differentiation within Asia is wide and consequential. In India, private investment recovery remains the critical domestic story, with healthy bank balance sheets and easing credit conditions creating the conditions for a rebound if external volatility subsides. Across the technology supply chain in Taiwan and South Korea, the semiconductor demand cycle, and the persistence of AI capex from hyperscalers, will ultimately determine whether the Q1 drawdown proves transient or marks a more extended re-rating. The LNG supply shock also introduces a multi-year dimension: with Ras Laffan's recovery expected to take years rather than months, countries that had pivoted toward LNG as their primary clean energy bridge face a prolonged period of elevated energy costs and constrained industrial output.
Currencies in Q1 2026
Q1 2026 presented a remarkable narrative arc for the major currency pairs, one in which the initial trajectory was abruptly and decisively overturned by geopolitical shock. The US dollar, the euro, the British pound, and the Japanese yen each entered January shaped by familiar macroeconomic forces, only to find those forces overwhelmed by the outbreak of armed conflict in the Middle East.
The US dollar began the year on the back foot. The dollar index, having shed roughly 10% over the course of 2025, its worst annual performance since 2017, continued to slide in early January, touching a multi-month low near 96 in February. The pressure on the greenback was both structural and sentiment-driven. The Fed had cut rates three times in 2025, bringing its benchmark to a target range of 3.50 – 3.75%, and markets entered the new year pricing in additional easing ahead. At its 28 January meeting, the FOMC elected to hold rates steady, though two governors dissented in favour of a further cut. The policy statement upgraded its assessment of economic activity while acknowledging that inflation remained ‘somewhat elevated,’ effectively signalling a pause rather than a pivot. Adding to dollar headwinds in January, President Trump's rhetorical threats toward European allies over Greenland, including a potential 10% tariff on eight European nations, initially sparked confusion before markets largely discounted the warnings. A notably weak January NFP print of just 50,000 jobs, released in early February, further reinforced the case for eventual Fed easing and kept the dollar under pressure.
The euro, by contrast, was a principal beneficiary of dollar softness through January and into February. The euro pushed above the 1.20 level, a threshold not tested for several years, as investors rotated away from US assets and toward European markets. The ECB, having concluded its rate-cutting cycle with the deposit rate anchored at 2.00% since June 2025, offered no new policy impulses in the quarter's early weeks. Eurozone inflation had dipped to 1.7% in January, below the ECB's 2% target, while the broader growth outlook remained modest, with most institutional forecasts clustering around 0.9 – 1.3% GDP expansion for the year. The ECB held rates for the sixth consecutive meeting in March, as widely expected, though the accompanying policy communiqué carried a decidedly more cautious tone than in prior months.
Sterling began the quarter similarly lifted by dollar weakness, though the BoE's domestic policy picture provided a more ambiguous backdrop. Having cut the Bank Rate to 3.75% in December 2025, the MPC held rates at its February meeting, accompanied by dovish messaging from Governor Bailey that acknowledged softening in the labour market and a likely further decline in inflation. Yet UK CPI remained at 3%, the highest rate among major Western economies and well above the Bank's 2% target, which constrained the pace of any anticipated easing.
The Japanese yen remained a source of persistent frustration for markets seeking a cleaner carry-trade unwind. The BoJ held its policy rate at 0.75% at both its January and March meetings, the January decision passing by an 8-1 vote with one board member advocating an immediate increase to 1.00%. Governor Ueda, in post-meeting remarks, explicitly linked yen weakness to the bank's monetary policy outlook, flagging that further currency depreciation could feed more persistently into underlying inflation. With the yen already weakening since the conflict began and Japan heavily dependent on Middle Eastern oil imports, the BoJ found itself navigating the difficult intersection of inflationary pressure from energy prices and fragile domestic growth. The Japanese yen opened the year at ¥156.65 and drifted to ¥159.00 by quarter-end, a trajectory that confounded those expecting a sharper yen recovery on the back of anticipated rate normalisation.
The defining rupture came on 28 February, when US and Israeli forces launched coordinated strikes on Iran under Operation Epic Fury. Tehran responded with missiles and drone strikes against US bases and regional allies, and declared the Strait of Hormuz ‘closed’, a chokepoint through which approximately one fifth of global oil supply and a significant share of LNG transits daily. The geopolitical risk premium that had been building incrementally through January and February crystallised instantly into market pricing. The dollar surged as investors unwound risk and sought safe-haven assets; by the end of March, the dollar index had recovered to approximately 100.50, a ten-month high.
The euro bore the brunt of the reversal. As an energy-importing bloc, the eurozone faced the twin headwinds of rising input costs and deteriorating terms of trade. Eurozone inflation climbed to 2.5% in March, driven by a 4.9% annual surge in energy prices, while the ECB revised its 2026 inflation forecast upward to 2.6% from 1.9%. Markets rapidly repriced ECB expectations, abandoning earlier assumptions of steady policy and beginning to price in one to two rate hikes for the year, a dramatic reversal that undermined the structural euro bull case. The euro closed the quarter near the $1.1500 level, a far cry from the highs seen just weeks earlier. The British pound tracked a similar pattern. Cable ended Q1 at $1.3221 as energy inflation erased much of the BoE's residual cutting optionality and dollar safe-haven flows dominated. The yen, meanwhile, weakened further against the dollar as Japan's oil import dependency amplified the negative shock, with survey data showing 60% of economists expecting the BoJ to hike to 1.00% by June, but providing little near-term support for the currency in a flight-to-quality environment. From a policy divergence perspective, US rates at 3.75% remained above the ECB's 2.00%, with the Fed on hold and no cut expected before at least June, reinforcing interest rate differentials that kept capital tilted toward the dollar heading into the Q2.
In Q1 the US dollar index rose +1.62% to 99.87, the euro declined by -1.62% to $1.1555. The British pound was down -1.87% to $1.3221 in Q1. The Japanese yen declined -1.30% to ¥158.68 against the US dollar through Q1.
Cryptocurrencies in Q1 and 2026 YTD
Bitcoin -22.21% Q1 and -22.00% YTD to $68,398.27
Ethereum -29.47% Q1 and -27.59% YTD to $2,156.81
Bitcoin and Ethereum have had their worst Q1 since 2018, falling dramatically under growing macro and geopolitical pressures as the war with Iran resulted in higher Treasury yields and stronger demand for traditional safe-haven assets. The quarter that began with expectations that the growth of Spot Bitcoin and Spot Ethereum ETFs, corporate treasury buying, and a friendlier US policy backdrop would propel crypto prices. Instead the Q1 drop extended a difficult stretch that began in Q4 2025, when Bitcoin slid 23% from $114,057 to $87,508.
The quarter ultimately showed how quickly geopolitical conflict can reshape crypto trading conditions. What began as a year with expectations of easier financial conditions instead turned into a period defined by war risk, energy shock, and a more complex rate outlook, leaving Bitcoin and the wider digital-asset market trading amid a broader global risk reset.
However, this current drop may reflect cyclical positioning rather than fundamental change, with institutional adoption trends, although weaker, still intact. Even though, as noted by BiTBo, Spot Bitcoin ETFs saw $496.5 million in net outflows during Q1, with $1.8 billion leaving in the first two months before $1.32 billion returned in March, there has been significant regulatory movement in the US over Q1 which is supportive to further institutional adoption. These movements include the SEC and CFTC issuing landmark joint guidance classifying 16 specific crypto assets and the SEC’s "Crypto Task Force" dropping dozens of enforcement actions initiated in previous years that were based solely on "unregistered exchange" allegations.
Bitcoin was +0.26% on Wednesday to $68,398.27 and Ethereum was +2.66% to $2,156.81.
Note: As of 5:00 pm EDT 1 April 2026
What to think about in Q2 2026
The tariff story isn’t over. It has been a year to the day since President Trump announced his “liberation day” tariffs. These tariffs were largely intended to revive US manufacturing and encourage businesses to reshore back to the US. They were expected to see an increase in investment into the US, creating new jobs, particularly in regions that had become economically depressed as older manufacturing industries moved offshore. They were designed to reduce the "large and persistent" trade deficit in goods, with the longer term goal of getting the deficit "back to zero". They were also intended to raise revenue for the government to, at least in part, finance the administration’s promised tax cuts that later came through in the “one big, beautiful bill.” Certain tariffs, such as those on steel, aluminum, and semiconductors, were aimed at reducing reliance on foreign suppliers for critical materials.
However, that is not what has happened. The initial reaction to those tariffs was a rise in market volatility with the frontloading of US imports in response to the threat of high tariffs. The situation has either largely worsened or showed limited, if any, positive change. Production growth remains marginal and procurement surveys point to sustained industrial weakness. Employment is trending downwards. US consumers and importers took the vast majority of the financial hit from tariffs.
What has become clearer over the past year is that the tariffs, which on 20 February the Supreme Court ruled mostly illegal, noting that the president does not have the authority to impose broad, open-ended tariffs by claiming a national emergency, were merely a bargaining tool to pressure other countries to change their practices, such as controlling the flow of illegal drugs (fentanyl) and migration at the border. As for the tariffs themselves, they largely proved to be ineffective. As noted by Martin Wolf in the Financial Times, global trade definitely did not die, but rather changed direction as US and Chinese exports reached new highs, while world trade also grew faster than the world economy. Despite tariff earnings helping to support government revenues up until the Supreme Court ruling, tariff earnings have barely made a dent in the federal debt.
What the tariffs did show was to push many companies outside the US to look beyond the US for buyers, as political leaders raced to improve non-US trade relationships. President Trump’s behaviour towards the US’ traditional allies in Europe and Asia has demonstrated his transactional approach to geopolitical relationships. This in turn has, at least over the short-term, damaged the US’ global relationships, encouraged retaliatory measures, and complicated US efforts to rally support for a variety of issues, from NATO to the war with Iran.
It appears that the Trump administration is committed to this strategy regardless of the fall-out. Currently, the US has imposed 10% tariffs on countries around the globe for 150 days, which could rise to 15% as the administration pursues other tariffs. The administration announced two new trade investigations in March, scrutinising 60 countries for their fair trade practices under Section 301 of the Trade Act of 1974. While global markets fret over the effects of the war with Iran, this issue remains ticking along in the background, with the potential to cause continued volatility well after the US and Iran come to any agreement.
Economic and Geopolitical Risk Calendar
In addition to monetary and fiscal policy changes, there are other factors that could affect market performance in Q2 2026. Among other scenarios that could develop in Q2, we see a strong potential for Q2 being marked by a pronounced dichotomy between regions. The surge in energy prices and the disruptions caused to the global energy supply and the export of other important commodities, such as fertilisers, is likely to raise overall costs, weigh on demand and add to inflationary pressures. The OECD now forecasts inflation in the US to rise from 2.6% in 2025 to 4.2% in 2026, in the UK to rise from 3.4% to 4.0% and across the EU from 2.1% in 2025 to 2.6% in 2026. Uncertainties around the strength of the US labour market are likely to dominate the Fed’s decisions in Q2. Given the inflationary impact of the surge in LNG and oil prices following the outbreak of the conflict with Iran, the ECB is widely expected to raise rates if the war does not end soon and the inflationary impacts appear more than transitory. In many ways the UK is in the worst position, with the real GDP growth forecast significantly downgraded by the OECD and Office for Budget Responsibility (OBR) to just 0.4% – 0.7%, down from a pre-conflict expectation of 1.1% – 1.2%. Inflation is expected to continue to rise. The labour market remains weak with inflation at 5.2% despite wage growth easing. Monetary policy is entering a period of heightened uncertainty, as the Fed faces having to balance an expected surge in inflationary pressures while the labour market continues to weaken. The underlying concerns around the sustainability of the US debt have not gone away. Markets will also be looking to see how the new Fed chair, Kevin Warsh, will respond to President Trump’s expectations of rate cuts.
The policy and geopolitical risks for investors that could negatively affect corporate earnings, stock market performance, currency valuations, sovereign and corporate bond markets and cryptocurrencies include:
April 2026
12 April Legislative elections, Hungary. The elections are expected to be a closely contested race between the ruling Hungarian Civic Alliance (Fidesz) and the centrist Respect and Freedom Party (Tisza). The election will be critical due to Prime Minister Viktor Orbán’s contrarian role within the EU, his stance on Ukraine, and his close ties with Russia and China.
13-19 April IMF and World Bank Spring Meetings, Washington, DC, USA. Finance ministers, central bank governors, and other officials from around the world will gather to discuss the global economic outlook, financial stability, economic development, and policies to address economic challenges.
27 April - 22 May The 2026 Review Conference of the Parties to the Treaty on the Non-Proliferation of Nuclear Weapons, New York, USA. The 2026 Review at the UN Headquarters in New York will provide an indication on international perspectives on non-proliferation. This will likely prove particularly lively given the war with Iran and its attempts to build nuclear weaponry.
27-28 April Bank of Japan Monetary Policy Meeting and Outlook Report. The BoJ may choose to raise rates at this meeting, but much will depend on the progression of the war with Iran. However, sticky core inflation, stronger-than-expected PMI figures in March, and positive wage negotiations appear to raise the odds of an April hike.
28-29 April Federal Reserve Monetary Policy Meeting. The Fed is widely expected to hold rates again at this meeting as it balances the risks of rising inflation resulting from the war with Iran against further weakening in the labour market.
29-30 April ECB Monetary Policy Meeting. Although it has been suggested by some ECB policymakers that the ECB will tighten rates in response to inflationary pressures, it is likely to wait until there is greater clarity around when the war with Iran will end and whether the inflationary impacts of the energy price surge will be more transitory or not.
30 April Bank of England Monetary Policy Meeting, Minutes, and April Monetary Policy Report. The BoE will likely keep rates on hold again in April as it awaits the outcome of the war with Iran. Inflation is expected to continue to tick higher this year, but with the labour market continuing to soften and growth also weakening, it will be a fine balance for the MPC.
May 2026
31 May Presidential election, Colombia. Colombia’s presidential election is increasingly looking like a three-way race. On the left is Iván Cepeda, a senator from the governing Historic Pact offering a continuation of the policies of current President, Gustavo Petro. On the far right is Defenders of the Homeland represented by Abelardo de la Espriella, a lawyer. The other expected main contender is centre-right Democratic Centre Senator Paloma Valencia of the Democratic Center, who counts ex-President Álvaro Uribe (2002–2010) as her political mentor.
June 2026
11 June ECB Monetary Policy Meeting. The ECB is likely to come under increasing pressure to respond to inflationary impacts following the surge in energy prices resulting from the conflict in Iran. If the ECB does not act in April, it will use this meeting to explore the indirect and secondary-round effects the energy surge has caused. If inflationary expectations appear to be rising, this may force the ECB to raise rates by 25 bps.
14-16 June G7 Leaders Summit, Évian-les-Bains, Haute-Savoie, France.
This will be the 52nd G7 Summit (Canada, France, Germany, Italy, Japan, the UK, the US, plus the EU). Leaders will meet to discuss global economic conditions, international security, climate and development issues, and other shared priorities.
15-16 June Bank of Japan Monetary Policy Meeting. The already fragile economy is expected to feel the consequences of the Iran war with the surge in fuel prices far beyond the actual duration of the war, complicating the Bank of Japan's rate decisions. A BoJ report suggested that the underlying inflation rate may face stronger upward pressure from rising oil prices and more yen falls than in the past. If the BoJ did not raise rates in April, it is widely expected it will by June.
16-17 June Federal Reserve Monetary Policy Meeting. The Fed may hold rates again at this meeting as it balances the risks of rising inflation resulting from the war with Iran against further weakening in the labour market. Although this will be the first meeting under a new chair, the policy direction is unlikely to change this month.
While every effort has been made to verify the accuracy of this information, EXT Ltd. (hereafter known as “EXANTE”) cannot accept any responsibility or liability for reliance by any person on this publication or any of the information, opinions, or conclusions contained in this publication. The findings and views expressed in this publication do not necessarily reflect the views of EXANTE. Any action taken upon the information contained in this publication is strictly at your own risk. EXANTE will not be liable for any loss or damage in connection with this publication.
This article is provided to you for informational purposes only and should not be regarded as an offer or solicitation of an offer to buy or sell any investments or related services that may be referenced here. Trading financial instruments involves significant risk of loss and may not be suitable for all investors. Past performance is not a reliable indicator of future performance.


Created by professionals. For professionals.
