
Is Brussels about to panic-buy the gas market?

Global Macro Updates
Are EU member states forced buyers of LNG? Europe enters the 2026 injection season in a structurally disadvantaged position, and the regulatory architecture designed to prevent the next supply shock may inadvertently amplify the very price spiral it sought to contain.
EU Regulation 2022/1032 mandates member states fill underground gas storage to at least 90% of capacity annually, a measure introduced after Russia's 2022 invasion of Ukraine. The framework was extended through end-2027 with modest flexibilities: the hard 1st November deadline was replaced with an 1st October – 1st December window, intermediate trajectory targets were made indicative rather than binding, and member states were granted up to 10 percentage points of deviation under "difficult market conditions", with the European Commission able to add a further 5 percentage points. In practice, the floor remains 75% capacity.
These flexibilities, while real, are limited. Crucially, they allow individual member states to defer purchases, not abandon them, and coordinated deferral across multiple countries is operationally difficult given differing storage infrastructure and pipeline interconnection constraints. Countries with limited domestic storage must rely on cross-border burden-sharing mechanisms, adding logistical friction to what is already a compressed injection window.
As of mid-March 2026, European storage sits below 30% of capacity, the lowest level since 2022, compared to a five-year average of approximately 41% for this time of year. Analysts estimate levels could fall to 22% – 27% by end-March before injections begin in earnest. The drawdown reflects both an exceptionally cold winter and a structural mismatch: LNG cargo arrivals ran at less than half of daily storage withdrawal volumes during the peak demand months of January and February.
To meet the 90% target by December under current regulation, Eurogas estimates member states would need to inject more than 60 bcm this summer, versus approximately 50 bcm injected during the prior injection season, a roughly 20% increase in injection volumes. Even with the full deployment of flexibility provisions, the injection requirement falls to roughly 45 bcm, still a formidable procurement task in a dislocated market.
The conflict in Iran has functionally closed the Strait of Hormuz to LNG traffic, taking offline approximately one fifth of global LNG supply, including Qatar's Ras Laffan terminal, the world's largest LNG export facility. QatarEnergy initially halted production following Iranian drone strikes on 2nd March, and subsequent Iranian missile strikes yesterday caused significant damage to Ras Laffan.
TTF front-month contracts touched €65/MWh in early March, a level not seen since January 2023. Asian spot LNG (JKM) spiked to approximately $25/MMBtu before retreating to around $18/MMBtu, still 80% above pre-conflict levels. Critically, at least nine LNG shipments originally bound for Europe were rerouted to Asia since hostilities began, as Asian buyers bid up spot cargoes above European hub-linked prices. This cross-basin arbitrage dynamic is the precise mechanism through which Europe's regulatory demand pull gets translated into a global price-setting event.
The core risk is a coordination failure among member states. With storage at multi-year lows and a legally binding refill target on the calendar, each country faces individual incentives to secure cargoes early, even at elevated prices, before competitors do. Germany, with reserves reported as low as 22% following a cold winter, and other large-storage nations face particularly acute pressure. It was this same dynamic that drove TTF above €300/MWh in 2022: binding storage deadlines created a predictable demand signal that traders could exploit, injecting urgency, and therefore a price premium, into every cargo negotiation.
Industry body Eurogas has called on the Commission to urgently signal full use of flexibility provisions and urge member states to adjust filling trajectories before April precisely to avoid signalling a compressed mass-buying window. The group also warned that EU rules governing LNG authorisation which require prior regulatory approvals risk making European buyers procedurally slower in a spot market where speed determines cargo allocation. The Commission has moved to soften these authorisation rules, but implementation lag remains a practical concern.
A convergence of factors, including the 60 bcm injection requirement, a supply shock, heightened competition from Asian markets, and a clearly defined regulatory deadline, creates a structurally elevated price floor for the summer injection season. The backwardation that had already been suppressing injection incentives entering the season, with summer TTF prices exceeding winter prices, now coexists with price levels high enough to threaten demand destruction in industrial and power-generation sectors.
EU member states are, functionally, forced buyers. The regulatory target is non-discretionary, storage deficits are deep, and the supply disruption has materially tightened the available cargo pool. Short of a substantial reduction in the 90% target, which three member states are reportedly lobbying for, including a proposed 30% cut, or a rapid resolution of the Hormuz blockade, European LNG procurement can serve as a persistent price floor for global gas markets.
Fed leaves rates unchanged, as expected. The March Federal Open Market Committee (FOMC) meeting concluded with the decision to keep interest rates unchanged at 3.50 - 3.75%, in line with broad expectations. Fed Governor Miran dissented, advocating for a quarter-point rate reduction, whereas earlier previews had suggested the possibility of up to three officials supporting a rate cut.
The Fed’s latest Summary of Economic Projections (SEP) indicates an anticipated reduction of 25 bps by the end of 2026, bringing the midpoint rate to 3.375%. In comparison, the December SEP also projected approximately 25 bps of cuts for 2026. However, leading up to the March meeting, market participants priced in less than 25 bps amid mounting oil prices and elevated Producer Price Index readings, whereas the previous month the market was pricing in approximately 60 bps of rate cuts for 2026.
Policymakers foresee the unemployment rate holding steady at 4.4% in 2026, unchanged from the December projection. The headline PCE inflation rate for 2026 is now expected to be 2.7%, up from December’s estimate of 2.4%, with core PCE also forecasted at 2.7%, compared to December’s 2.5%. GDP growth is projected at 2.4%, slightly higher than December’s forecast of 2.3%.
The FOMC statement itself underwent minimal revisions. It now notes that the unemployment rate has "little changed in recent months," a shift from the previous characterisation of having "shown some signs of stabilisation." Additionally, a new line was introduced addressing the uncertain ramifications of the ongoing conflict in the Middle East.
Key points from the press conference include Chair Powell’s emphasis on avoiding overly restrictive policies due to potential downside risks to employment. He acknowledged that progress on reducing inflation has been slower than anticipated and stressed that it is premature to assess the full impact of the Middle East war. Powell also mentioned that part of the oil price shock is expected to be reflected in core inflation in the near future, while progress on tariff-related inflation may require more time.
February PPI surpasses expectations. Core Producer Price Index (PPI) for February increased by 0.5% m/o/m, exceeding the consensus estimate of 0.3% and following January’s unrevised gain of 0.8%. On an annualised basis, core PPI rose 3.9%, compared to expectations of 3.5% and January’s figure of 3.5%. The three-month annualised pace for core PPI surged to 7.81%, the fastest rate since May 2022.
The headline PPI advanced by 0.7% m/o/m, also surpassing the consensus of 0.3% and January’s unrevised 0.5%. The increase in January marked the largest rise since July 2025. On an annualised basis, headline PPI climbed 3.4%, above both the consensus of 2.9% and January’s 2.9% reading.
More than half of February’s monthly increase stemmed from a 0.5% gain in services, while goods prices rose by 1.1%, the largest uptick in goods since August 2023. Over 20% of the monthly increase in the final demand goods index was driven by a 48.9% jump in prices for fresh and dry vegetables.
Breaking down the data further, transportation and warehousing services rose 0.5%, following a 1.2% increase in January. Energy prices increased 2.3%, reversing the 2.3% decline seen in January. Trade services advanced 0.4%, building on a 2.2% rise the previous month. Additionally, egg prices experienced a sharp rebound, surging 93.6% after having declined by 63.9% in January.
For components that contribute to the Consumer Price Index, portfolio management fees increased by 1.0%, following a 3.1% jump in January. Airline passenger services fell 0.6%, compared to a 2.5% gain previously. Outpatient care costs edged up 0.3%, after a 0.9% decline in January.
Global market indices
US Stock Indices Price Performance
Nasdaq 100 -2.14% MTD and -3.27% YTD
Dow Jones Industrial Average -5.62% MTD and -3.82% YTD
NYSE -6.38% MTD and -0.03% YTD
S&P 500 -3.70% MTD and -3.23% YTD
The S&P 500 is -0.72% over the past seven days, with 10 of the 11 sectors down MTD. The Equally Weighted version of the S&P 500 is -0.13% over this past week and +0.62% YTD.
The S&P 500 Energy is the leading sector so far this month, +4.38% MTD and +29.82% YTD, while Materials is the weakest sector at -9.99% MTD and +5.88% YTD.
Over the past seven days, Energy outperformed within the S&P 500 at +1.66%, followed by Utilities and Financials at +0.45% and +0.22%, respectively. Conversely, Industrials underperformed at -2.59%, followed by Materials and Consumer Staples at -2.54% and -2.30%, respectively.
The equal-weight version of the S&P 500 was -1.29% on Wednesday, outperforming its cap-weighted counterpart by 0.34 percentage points.
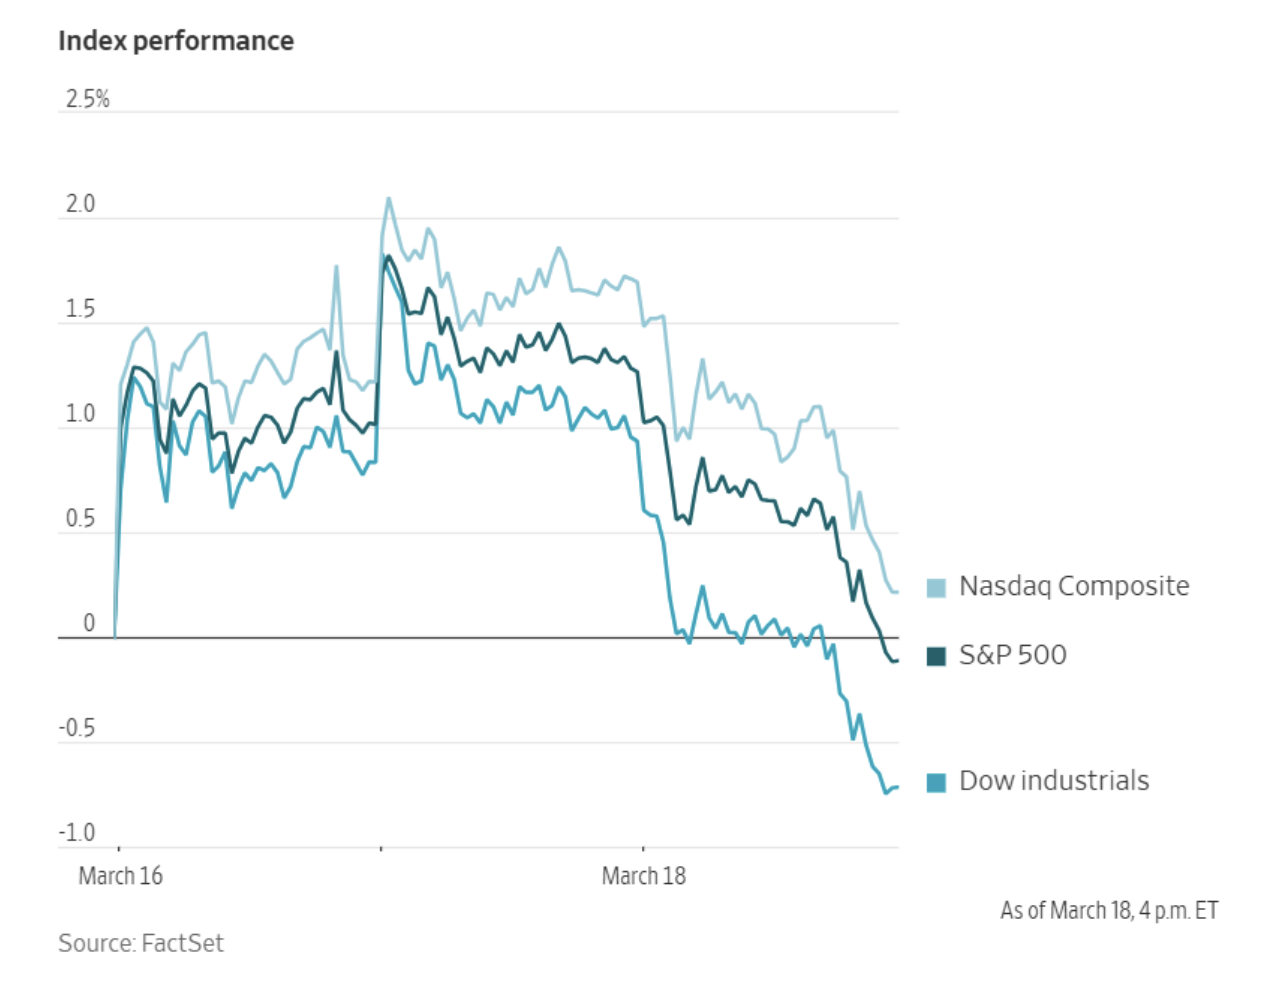
The Dow Jones Industrial Average declined -1.63%, or 768.11 points, to close at 46,225.15 points. The S&P 500 fell -1.36%, to 6,624.70, while the Nasdaq Composite posted a similar loss of -1.46%. Over the past seven days, the S&P 500 is -0.72%, the Dow Jones -0.97%, and the Nasdaq Composite -0.55%.
In corporate news, Micron Technology indicated that significant capital expenditures will be necessary to expand production capacity in response to rapidly growing demand, a disclosure that tempered the overall positive outlook provided by the leading US manufacturer of computer memory chips.
Macy’s projected Q1 sales that exceeded market expectations, suggesting a strong start to the fiscal year as consumer spending among middle- and higher-income households remains resilient.
General Mills reported Q4 results that fell short of Wall Street forecasts, primarily due to strategic price reductions. However, company executives expressed confidence that these pricing actions will yield positive results in the near term.
Swarmer, a developer of AI drone software, experienced a 1,000% increase in its share price over two days, marking the most successful US stock debut in nearly a year.
Mega caps: The Magnificent Seven had a mostly negative performance over the past week. Over the last seven days, Alphabet +1.36%, and Amazon +0.16%, while Tesla -0.56%, Nvidia -1.50%, Microsoft -2.51%, Meta Platforms -3.53%, and Apple -4.17%.
Energy stocks had a mostly positive performance this week. The Energy sector itself was +1.66%. WTI and Brent prices are +9.87% and +17.11%, respectively, over the past week. Over the last seven days, APA +11.04%, BP +5.03%, Shell +4.01%, Baker Hughes +2.83%, ConocoPhillips +2.82%, Marathon Petroleum +2.68%, ExxonMobil +2.64%, Chevron +0.83%, and Halliburton +0.81%, while Occidental Petroleum -0.05%, Phillips 66 -0.78%, and Energy Fuels -5.04%.
Materials and Mining stocks had a mostly negative performance this week, with the Materials sector itself -2.54%. Over the past seven days, Celanese Corporation +0.49%, and Yara International +0.07%, while Albemarle -1.29%, Nucor -2.72%, Mosaic -4.70%, Freeport-McMoRan -6.35%, CF Industries -6.82%, Newmont Corporation -8.32%, and Sibanye Stillwater -11.17%.
European Stock Indices Price Performance
Stoxx 600 -5.67% MTD and +0.97% YTD
DAX -7.05% MTD and -4.03% YTD
CAC 40 -7.12% MTD and -2.20% YTD
IBEX 35 -5.78% MTD and -0.05% YTD
FTSE MIB -5.23% MTD and -0.45% YTD
FTSE 100 -5.55% MTD and +3.76% YTD
This week, the pan-European Stoxx Europe 600 index is -0.16%. It was -0.75% Wednesday, closing at 597.93.
So far this month in the STOXX Europe 600, unsurprisingly, Oil & Gas is the leading sector +10.25% MTD and +30.81% YTD, while Autos & Parts is the weakest at -11.64% MTD and -13.07% YTD.
Over the past seven days, Oil & Gas outperformed within the STOXX Europe 600, at +4.16%, followed by Insurance and Banks at +2.40% and +1.19%, respectively. Conversely, Basic Resources underperformed at -3.43%, followed by Personal & Household Goods and Autos & Parts at -2.63% and -2.33%, respectively.
Germany's DAX index was -0.93% Wednesday, closing at 23,502.25. It was -0.37% over the past seven days. France's CAC 40 index was -0.06% Wednesday, closing at 7,969.88. It was -0.18% over the past week.
The UK's FTSE 100 index was flat over the past seven days to 10,305.29. It was -0.94% on Wednesday.
In Wednesday's trading session, cyclical sectors outperformed, with banks providing the largest boost to the benchmark Stoxx 600 index as relief from oil prices translated into improved rate and growth expectations. BNP Paribas advanced after outlining ambitious asset-gathering and profitability targets for 2030, while the broader banking sector benefitted from renewed risk appetite following heavy selling earlier in the week. Attention also focused on news that UBS completed the migration of Credit Suisse clients in Switzerland.
Industrial Goods & Services also outperformed, driven by robust earnings and order momentum. Diploma shares surged after raising guidance significantly, with management highlighting very strong trading and potential for further EPS upside through M&A. Airbus gained after aircraft leasing company AerCap agreed to purchase 100 A320neo-family jets, and Kongsberg Gruppen shares rose following a NOK2B F-35 order. Transportation companies were also higher, with Stadler Rail posting strong results and announcing a 150% dividend increase.
Construction & Materials was another area of strength, supported by signs of stabilisation in end-markets and positive analyst commentary. Heidelberg Materials rose after Morgan Stanley upgraded its rating to overweight, arguing that the current valuation already factors in minimal growth and no margin expansion. Travel & Leisure advanced for the third consecutive session as falling oil prices eased fuel-cost concerns, although air fares remain elevated. Fraport rose after results broadly met expectations and aviation trends stayed favourable.
Basic Resources also traded higher, buoyed by improving cyclical sentiment amid easing oil prices, though industrial metals were generally lower. Boliden edged up after its capital markets day reassured investors on CapEx discipline, while BHP advanced as the appointment of a new CEO candidate was viewed positively for strategic continuity. Real Estate firmed on reduced immediate energy pressures and selective stock strength, with TAG Immobilien rising after exceeding FFO expectations and delivering a 10% increase in NAV per share.
On the downside, Food & Beverage was the biggest drag among defensive sectors. HelloFresh declined sharply following disappointing full-year 2025 results and weak guidance for 2026, while Unilever fell amid ongoing debate about portfolio reshaping, including a potential separation of its food division after the planned ice-cream spin-off. Telecom, Personal & Household Goods, and Media were also impacted by defensive outflows as pro-cyclical sectors led the market higher.
Utilities, often regarded as proxies for bonds and data centres, were decliners in response to the risk-on tone. The sector was further pressured by Verbund shares dropping after weaker hydro and renewables output negatively affected full-year 2025 EBITDA, while National Grid fell following a Jefferies downgrade, with its valuation seen as full. Health Care underperformed despite isolated gainers, with Sonova a notable decliner after Jefferies initiated coverage at underperform, warning that tailwinds from Costco and the US VA are fading as competition from Demant intensifies.
Other Global Stock Indices Price Performance
MSCI World Index -4.73% MTD and -2.01% YTD
Hang Seng -2.27% MTD and +1.54% YTD
Over the past seven days, the MSCI World Index and Hang Seng Index are -1.91% and +1.20%, respectively.
Currencies
EUR -2.98% MTD and -2.39% YTD to $1.1464
GBP -1.62% MTD and -1.54% YTD to $1.3266
On Wednesday, the US dollar appreciated against other major currencies, recovering losses sustained over the previous two sessions after the FOMC opted to keep interest rates unchanged. The dollar index was +0.33% to 99.25. Over the week, the dollar index was +1.05% higher. The dollar index is +2.71% MTD and +2.05% YTD.
The Fed projected higher inflation and signalled that a single interest rate reduction is likely this year, as policymakers assessed the economic ramifications of the ongoing US and Israeli conflict with Iran.
Since the onset of the Middle East conflict on 28th February, the dollar has broadly strengthened, reaching a 10-month high late last week.
In the press conference following the Fed's decision, Chair Jerome Powell stated that the central bank would look past the effects of elevated oil prices resulting from the conflict, provided that further progress is made this year in reducing core inflation driven by goods prices.
The ECB, BoE, and BoJ are scheduled to announce their rate decisions today.
While these institutions are widely expected to maintain their current interest rates, market participants will be closely monitoring their communications for indications regarding the future direction of borrowing costs, particularly in light of potential inflationary pressures stemming from the Middle East conflict.
Since the end of February, the dollar has appreciated by +2.98% against the euro, with a further gain of +0.62% recorded on Wednesday. The euro has declined -0.94% over the past seven days.
The dollar rose +0.49% against the Japanese yen on Wednesday, reaching ¥159.75. It is +0.57% over the past seven days, +2.36% MTD and +1.98% YTD.
The Japanese yen is currently trading near its 2024 intervention threshold, raising concerns that Japanese authorities may intervene in the currency markets once again.
Similarly, the British pound declined -0.67% to $1.3266 amid a volatile session shaped by concerns over a potential oil supply shock. Over the past seven days, sterling has depreciated by -1.05% against the greenback.
Note: As of 5:00 pm EDT 18 March 2026
Cryptocurrencies
Bitcoin +8.90% MTD and -18.69% YTD to $71,303.13
Ethereum +14.76% MTD and -25.98% YTD to $2,204.75
Bitcoin was +0.76% over the last seven days and Ethereum was +6.33%. On Wednesday, Bitcoin was -4.56% to $71,303.13. Ethereum was -5.75% to $2,204.75.
Bitcoin has continued its grind higher, trading in the low-mid‑$70,000 area after recovering from a rocky start to 2026, with CME futures open interest and basis both edging up, underscoring sustained institutional positioning. Over the past week, spot crypto ETFs in the US have seen choppy but net‑positive flows, with Bitcoin products stabilising after earlier outflows and Ethereum vehicles flipping back to inflows, including a $71 million net-positive day for ETH ETFs that signals renewed institutional demand for “beta plus yield” via staking-linked structures.
On the policy side, the SEC’s new guidance clarifying how federal securities laws apply to staking, airdrops, and wrapped tokens removes some tail risk around enforcement, an important step for compliance‑sensitive allocators evaluating on‑chain yield and tokenised strategies.
A new Coinbase/EY‑Parthenon survey meanwhile shows 74% of institutions plan to increase crypto allocations in 2026, with a clear pivot toward regulated wrappers such as ETFs and ETPs, reinforcing the asset class’s migration into mainstream portfolio construction.
Note: As of 5:00 pm EDT 18 March 2026
Fixed Income
US 10-year yield +31.3 bps MTD and +9.3 bps YTD to 4.265%
German 10-year yield +29.2 bps MTD and +8.8 bps YTD to 2.948%
UK 10-year yield +32.4 bps MTD and +20.2 bps YTD to 4.680%
On Wednesday, US Treasury yields moved higher following the Fed’s decision to leave interest rates unchanged, as anticipated by the market, while reaffirming its projection for a single rate cut in 2026.
Additionally, the Fed revised its growth outlook for both the current and upcoming year. In remarks after the announcement, Chair Jerome Powell emphasised that the US economy has demonstrated resilience in the face of various challenges.
The yield on the two-year Treasury note, sensitive to expectations for Fed policy, climbed +9.5 bps to 3.779%.
The 10-year yield increased by +6.2 bps to 4.265%, and the 30-year yield edged up by +0.2 bps to 4.886%.
The spread between two- and 10-year note yields flattened to 48.6 bps, which is 8.4 bps narrower than the previous week’s 57.0 bps.
Over the past week, at the front-end of the curve, the 2-year yield increased +11.8 bps, the 10-year yield advanced +3.4 bps and at the longer end, the 30-year yield was +0.1 bps higher.
Expectations for a rate cut by the Fed have continued to fall this week due to the rise in oil prices. According to CME Group's FedWatch Tool, Fed funds futures traders are now pricing in a 0.0% probability of a 25 bps rate cut at April’s FOMC meeting, from 0.2% last week. Markets are currently pricing 17.3 bps of easing for this year, down from 31.9 bps last week.
Across the Atlantic, in the UK, on Wednesday the 10-year gilt was +5.5 bps to 4.680%. Over the past seven days, it was +5.3 bps.
Eurozone government bond yields advanced on Wednesday, reversing their earlier trajectory from the beginning of the session.
The yield on the German 10-year Bund increased by +4.0 bps to 2.948% after an initial decline earlier in the day.
Two-year Bund yields have risen by +37.2 bps so far this month; however, they slipped -1.3 bps to 2.388% after remaining flat earlier in the session. At the long end of the German yield curve, the 30-year yield declined by -4.0 bps to 3.474%.
Italy’s BTP 10-year bond yields advanced +7.7 bps to 3.739%, while French 10-year yields were up +4.3 bps at 3.611%.
The spread between German and Italian 10-year bond yields widened by 6.8 bps over the past week, reaching 79.1 bps from 72.3 bps. The Italian 10-year yield was +7.6 bps over the same period.
The ECB is not expected to adjust its policy stance at this meeting. Consequently, market participants will closely monitor any remarks from ECB President Christine Lagarde regarding the justification for current market pricing, which anticipates two possible rate hikes this year, as well as any comparisons she may draw with developments in 2022.
Over the past seven days, the German 10-year yield is +0.8 bps. Germany's two-year bond yield is +1.1 bps, while Germany's 30-year yield is -2.0 bps.
The yield spread between German Bunds and 10-year UK gilts reached 173.2 bps on Wednesday, a rise of 4.5 bps over the past seven days.
The spread between US 10-year Treasuries and German Bunds is now 131.7 bps, 2.6 bps wider from last week’s 129.1 bps.
Over the course of the week, France’s 10-year yield has risen +4.3 bps. The spread between the French OAT 10-year yield and German Bund 10-year yield stood at 66.3 bps, 3.5 bps more than last week’s 62.8 bps.
Commodities
Gold spot -9.04% MTD and +11.67% YTD to $4,817.63 per ounce
Silver spot -20.16% MTD and +5.75% YTD to $75.36 per ounce
West Texas Intermediate crude +48.34% MTD and +73.87% YTD to $99.82 a barrel
Brent crude +49.77% MTD and +80.02% YTD to $109.65 a barrel
Following the Fed's latest policy announcement on Wednesday, spot gold continued to trade lower, reaching its lowest point in over a month. The decline can be attributed to the strengthening US dollar.
During the session, spot gold dropped by -3.73% to $4,817.63 per ounce, marking its lowest level since 6th February. Concurrently, the US dollar's appreciation contributed to gold's decreased affordability for international buyers. Spot gold is -9.04% MTD and +11.67% YTD.
Spot silver fell -4.96% on Wednesday to $75.36 per ounce. Over the past seven days, silver prices have decreased -12.16%. Spot silver is -20.16% MTD and +5.75% YTD.
Oil prices settled higher on Wednesday after Iran launched attacks on several energy facilities across the Middle East. These actions followed a strike on Iran’s South Pars gas field and marked a significant escalation in the ongoing conflict involving the US and Israel.
Brent crude futures advanced in post-settlement trading, extending gains after closing up +5.94% at $109.65 per barrel. Meanwhile, US WTI crude also moved higher, finishing the day up $3.80, or +3.96%, at $99.82 per barrel. WTI and Brent oil prices saw significant increases over the last week, with WTI rising by +9.87% and Brent experiencing an even sharper surge of +17.11%.
WTI futures settled at their widest discount to Brent in eleven years, pressured by increased supply from releases of the US Strategic Petroleum Reserve and rising freight costs. In contrast, Brent futures were bolstered by renewed attacks on energy infrastructure in the Middle East.
Qatar’s state oil and gas company announced that Ras Laffan Industrial City, a key hub for the energy sector, sustained extensive damage following Iranian missile strikes. Saudi Arabia reported intercepting and destroying multiple ballistic missiles aimed at Riyadh, as well as thwarting a drone attack targeting an eastern gas facility.
Iran issued evacuation warnings for several energy facilities in Saudi Arabia, the UAE, and Qatar, indicating that these sites would be targeted in forthcoming strikes, according to Iranian state media reports released Wednesday.
This warning followed an attack on Iran’s South Pars gas field, which Israeli media claimed was carried out by Israel with US approval. Neither government immediately acknowledged responsibility for the incident.
On Wednesday, the US administration announced a 60-day waiver of the Jones Act shipping law, allowing foreign-flagged vessels to transport fuel, fertiliser, and other goods between US ports temporarily.
The administration also plans to temporarily lift federal smog-reduction requirements for summer-blend gasoline, according to sources cited by Reuters. However, these measures had only a marginal impact on gasoline futures contracts.
Analysts and traders suggested that these steps could help mitigate the surge in US fuel prices, although they are unlikely to significantly affect global energy markets.
Additionally, the US issued a general licence permitting certain transactions involving Venezuela’s state oil company PDVSA. Reports also indicated that Vice President JD Vance and other key Trump administration officials are scheduled to meet with the American Petroleum Institute, the largest US oil industry trade group, on Thursday.
In Iraq, the North Oil Company announced the resumption of crude exports from Kirkuk fields to Turkey’s Ceyhan port via pipeline, following an agreement between Baghdad and the Kurdistan Regional Government. The initial export capacity is set at 250,000 barrels per day.
Iraq’s state oil company SOMO signed contracts with international carriers and buyers to export crude oil through Turkey, Jordan, and Syria, as reported by the Iraqi state news agency on Wednesday.
Libya’s National Oil Corporation stated early Wednesday that flows from the Sharara oilfield are being gradually redirected through alternative pipelines following a fire outbreak.
EIA report. The latest US Energy Information Agency (EIA) report released on Wednesday showed that US crude oil inventories increased last week, supported by the highest inflows from Venezuela and Mexico since 2024. In contrast, gasoline and distillate stockpiles declined.
For the week ending 13th March, crude inventories rose by 6.2 million barrels, reaching a total of 449.3 million barrels. Crude stocks at the Cushing, Oklahoma, delivery hub expanded by 944,000 barrels, marking their highest level since August 2024.
Commercial crude oil imports climbed to their highest point since November 2024. Despite this, net US crude imports decreased by 692,000 barrels per day (bpd), attributable to a significant increase in crude exports, which surged by 1.47 million bpd to 4.9 million bpd.
Crude imports along the Gulf Coast attained their peak since July 2020, with flows from Saudi Arabia also reaching a multi-year high. Imports from Venezuela were the highest since December 2024, and those from Mexico hit their highest value since November 2024.
Refinery crude throughput increased by 63,000 bpd, while utilisation rates edged up by 0.6 percentage point to 91.4%.
US gasoline inventories declined by 5.4 million barrels to 244 million barrels. Similarly, distillate stockpiles, which include diesel and heating oil, decreased by 2.5 million barrels to 116.9 million barrels.
Total product supplied, a key indicator of demand, rose by 438,000 bpd, bringing the aggregate to 21.639 million bpd. However, the volume of jet fuel supplied fell to its lowest level since February 2024.
Note: As of 5:00 pm EDT 18 March 2026
Key data to move markets
EUROPE
Thursday: ECB Main Refinancing Operations Rate, Monetary Policy Statement, and Rate on Deposit Facility and Press Conference
Friday: German Producer Price Index (PPI), and a speech by Bundesbank President Joachim Nagel
Saturday: A speech by ECB Board Member Piero Cipollone
Monday: Consumer Confidence
Tuesday: German, French, and eurozone’s HCOB Services, Manufacturing, and Composite PMIs
Wednesday: IFO Survey of Business Climate and Current Assessment and Expectations
UK
Thursday: Average Earnings, Claimant Count Rate and Change, Employment Change, ILO Unemployment Rate, BoE Interest Rate Decision, BoE Minutes, BoE Monetary Policy Statement, and BoE MPC Vote
Tuesday: S&P Global Services, Manufacturing and Composite PMIs
Wednesday: Consumer Price Index (CPI), Core CPI, Producer Price Index (PPI), Core PPI, Retail Price Index and a speech by BoE External Member Megan Greene
USA
Thursday: Initial and Continuing Jobless Claims, Philadelphia Fed Manufacturing Survey, and New Home Sales
Tuesday: ADP Employment Change, Nonfarm Payrolls, Unit Labor Costs, S&P Global Services, Manufacturing and Composite PMIs
JAPAN
Wednesday: BoJ Interest Rate Decision and Monetary Policy Statement
Thursday: BoJ Press Conference
Monday: National CPI and National Core CPI
Tuesday: BoJ Monetary Policy Meeting Minutes
CHINA
Thursday: PBoC Interest Rate Decision
While every effort has been made to verify the accuracy of this information, EXT Ltd. (hereafter known as “EXANTE”) cannot accept any responsibility or liability for reliance by any person on this publication or any of the information, opinions, or conclusions contained in this publication. The findings and views expressed in this publication do not necessarily reflect the views of EXANTE. Any action taken upon the information contained in this publication is strictly at your own risk. EXANTE will not be liable for any loss or damage in connection with this publication.
This article is provided to you for informational purposes only and should not be regarded as an offer or solicitation of an offer to buy or sell any investments or related services that may be referenced here. Trading financial instruments involves significant risk of loss and may not be suitable for all investors. Past performance is not a reliable indicator of future performance.


Created by professionals. For professionals.
