
What will be the war’s longer term effects?

Markets in March
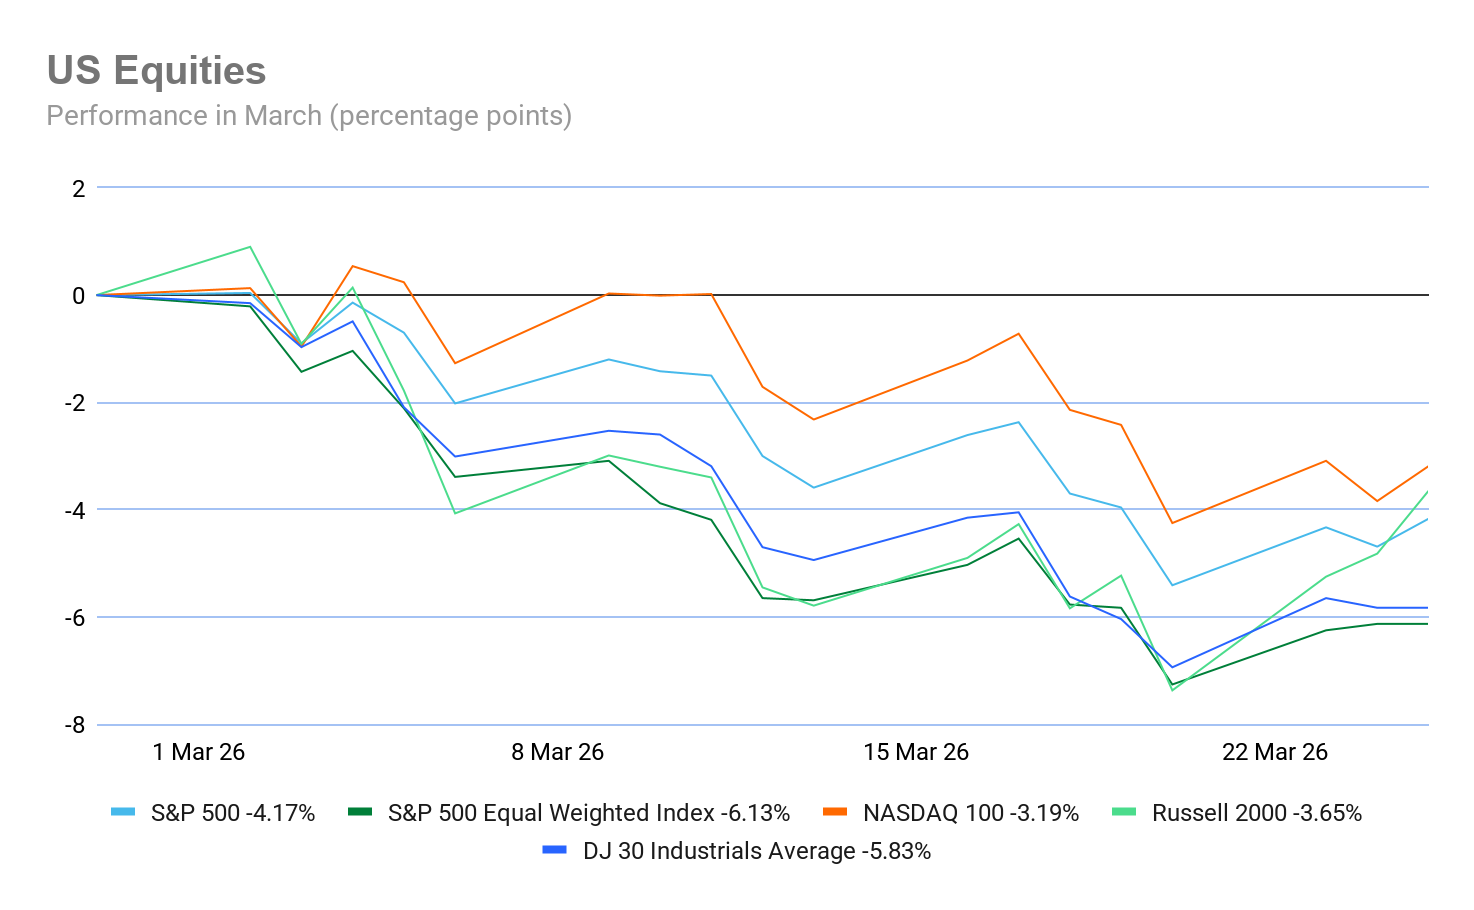
March has seen US equity markets reacting to rising inflation fears as the ongoing conflict in Iran threatens to de-anchor inflation expectations and degrades growth prospects around the world. Major US indices have shown a negative month-to-date (MTD) performance: S&P 500 -4.17%, Nasdaq 100 -3.19%, Dow Jones -5.83%, and Russell 2000 -3.65%.
Global bond markets saw yields surging this month as rising inflation fears due to soaring oil and gas prices kept central banks cautious. The Fed, the BoE, the ECB, and the BoJ all kept rates on hold. The dollar rose on rising expectations of a “higher for longer” rate environment, as a safe haven, and due to increasing demand as oil, priced in USD, continued to rise. Emerging market bonds underperformed as well as their currencies were hit by a rising dollar. Gold plunged as investors sought liquidity to cover margin calls, interest rate expectations rose, making the non-yielding asset less attractive, and the dollar rose, making it more expensive for non-USD currency buyers.
The economic picture
USA: US economic data was already showing signs of weakness prior to the outbreak of the US-Israel-led war with Iran. Nonfarm payrolls were down 92,000 in February 2026, marking a sharp reversal from January's 130,000 increase and falling far short of expectations for a 59,000 gain. The unemployment rate rose to 4.4%, driven by declines in healthcare, information, and government sectors, partly due to strikes and bad weather. However, according to ADP, private sector employment increased by 63,000 jobs in February and pay was up 4.5% on a y/o/y basis. On the growth front, business activity fell again in March with the March Flash S&P Global Composite PMI index falling to an 11-month low of 51.4, down from 51.9 in February due to a weaker upturn in new orders and spike in prices following the outbreak of war in the Middle East, as services sector activity fell. The Flash Services PMI came in at 51.1 from February’s 51.7, an 11-month low. The Flash Manufacturing PMI however was up, rising to 52.4 from February’s 51.6. Companies are stock building due to concerns that the war may lead to more protracted supply issues and price rises. Input costs have already reached a 10-month peak. Employment contracted for the first time in more than a year, as firms sought to reduce overheads amid heightened economic uncertainty. Additionally, final figures for Q4 nonfarm productivity showed an increase of 1.8%, falling short of the 2.0% consensus and the preliminary estimate of 2.8%. Unit labour costs rose by 4.4%, outpacing both the consensus of 3.5% and the preliminary reading of 2.8%. On the consumer side, the March reading of the University of Michigan confidence survey indicated that US consumer sentiment fell this month from February’s 56.4 to 55.5 in March with consumer sentiment dipping about 2%, reaching its lowest reading of the year. Year-ahead inflation expectations remained at 3.4%. Long-run inflation expectations inched down to 3.2%. Annualised inflation remained at 2.4% in February, according to the Bureau of Labor Statistics. It was + 0.3% m/o/m. Core annualised CPI was +2.5% y/o/y and 0.3% m/o/m. However, the Fed's favoured inflation measure, the core PCE price index, was +3.1% in January and +0.4% m/o/m.
EU: The euro area is increasingly sending stagflationary signals. Eurozone headline inflation in February rose to 1.9% y/o/y, up from 1.7% in January. Core inflation was 2.4% year-on-year, also up from January’s 2.2%. The closely watched services gauge rose to 3.4% from 3.2% in January. In addition, the ECB’s wage tracker forecasts salaries will rise by an annual 2.5% in the third and 2.6% in the fourth quarter and will put increasing pressure on the ECB. In terms of euro area growth, prices are rising sharply higher while negatively affecting growth. The S&P Flash Eurozone Composite PMI dropped to 50.5 in March from 51.9 in February, a 10-month low, largely due to a decline in the service sector. The Flash Services PMI came in at 50.1, down from February’s 51.9 and a 10-month low. Meanwhile, manufacturing production increased modestly, with the Flash Manufacturing PMI coming in at 51.4, up from February’s 50.8 and a 45-month high. The main changes were in the eurozone core economies: output continued to rise in Germany, helped by the fastest expansion in manufacturing production in over four years, but fell again in France. However, there was also a marked acceleration in the rate of input cost inflation. Input prices increased at the fastest pace since February 2023. The war in the Middle East also caused lengthening lead times for inputs in the eurozone manufacturing sector. Suppliers' delivery times lengthened to the greatest extent since August 2022. Fourth quarter 2025, GDP growth was indicated at 0.2% according to the ECB, which is also now forecasting only 0.9% annual real GDP growth for 2026. Simultaneously, employment decreased for the third month running. Most of this decline was in manufacturing, which has seen job cuts every month since June 2023. Services employment had its weakest growth since September 2025. As noted by Eurostat, in January 2026, the latest date for employment data, the euro area seasonally adjusted unemployment rate was 6.1%, down from 6.2% in December 2025 and from 6.3% in January 2025.
In addition, European consumers are starting to lose confidence. According to the European Commission, there was a plunge in euro area consumer confidence in March with the flash estimate of the consumer confidence indicator falling -4.0 percentage points to -16.3 points, markedly below its long-term average and reaching its lowest level since October 2023.
UK: The UK economy is now showing definite signs of weakening amid labour market softness with events in the Middle East creating surging price pressures as the prospect of higher interest rates and not the expected rate cuts this year weighs on businesses and consumers. According to the Office for National Statistics, the UK unemployment rate increased by 0.1 percentage points to 5.2%. However, the UK economic inactivity rate decreased by 0.3 percentage points to 20.7%, compared with August to October 2025. The S&P Global Flash Composite PMI fell to 51.0 in March from February’s 53.7, a 6-month low. The Flash Services PMI also fell, reaching 51.2. This was down from February’s 53.9, and also a 6-month low. The Flash Manufacturing PMI fell moderately to 51.4 from February’s 51.7, and a 3-month low.
Inflation in the UK remains above the BoE target and is expected to rise higher despite the BoE holding rates at 3.75% earlier this month in a 9-0 vote. However, the BoE stated that it stood “ready to act” against a surge in inflation triggered by war in the Middle East. The BoE has suggested higher prices at petrol pumps will boost inflation to 3.5% in March and that is before consumers will be hit by higher gas and electricity bills in the summer. As a result of the surge in British yields given the UK’s dependency on imported oil and gas, traders have priced in two quarter-point increases, with a strong chance of a third by the end of the year. Headline CPI remained at 3.0% in the 12 months to February 2026, and was up 0.4% m/o/m. Core inflation rose by 3.2% compared to February 2025 levels, up from 3.1% in January. February’s data also showed a slight easing in service sector inflation to 4.3%, down from January’s 4.4%.
Global market indices
USA:
S&P 500 -4.17% MTD and -3.70% YTD
Nasdaq 100 -3.19% MTD and -4.30% YTD
Dow Jones Industrial Average -5.83% MTD and -4.03% YTD
NYSE Composite -5.82% MTD and +0.56% YTD
Source: FactSet
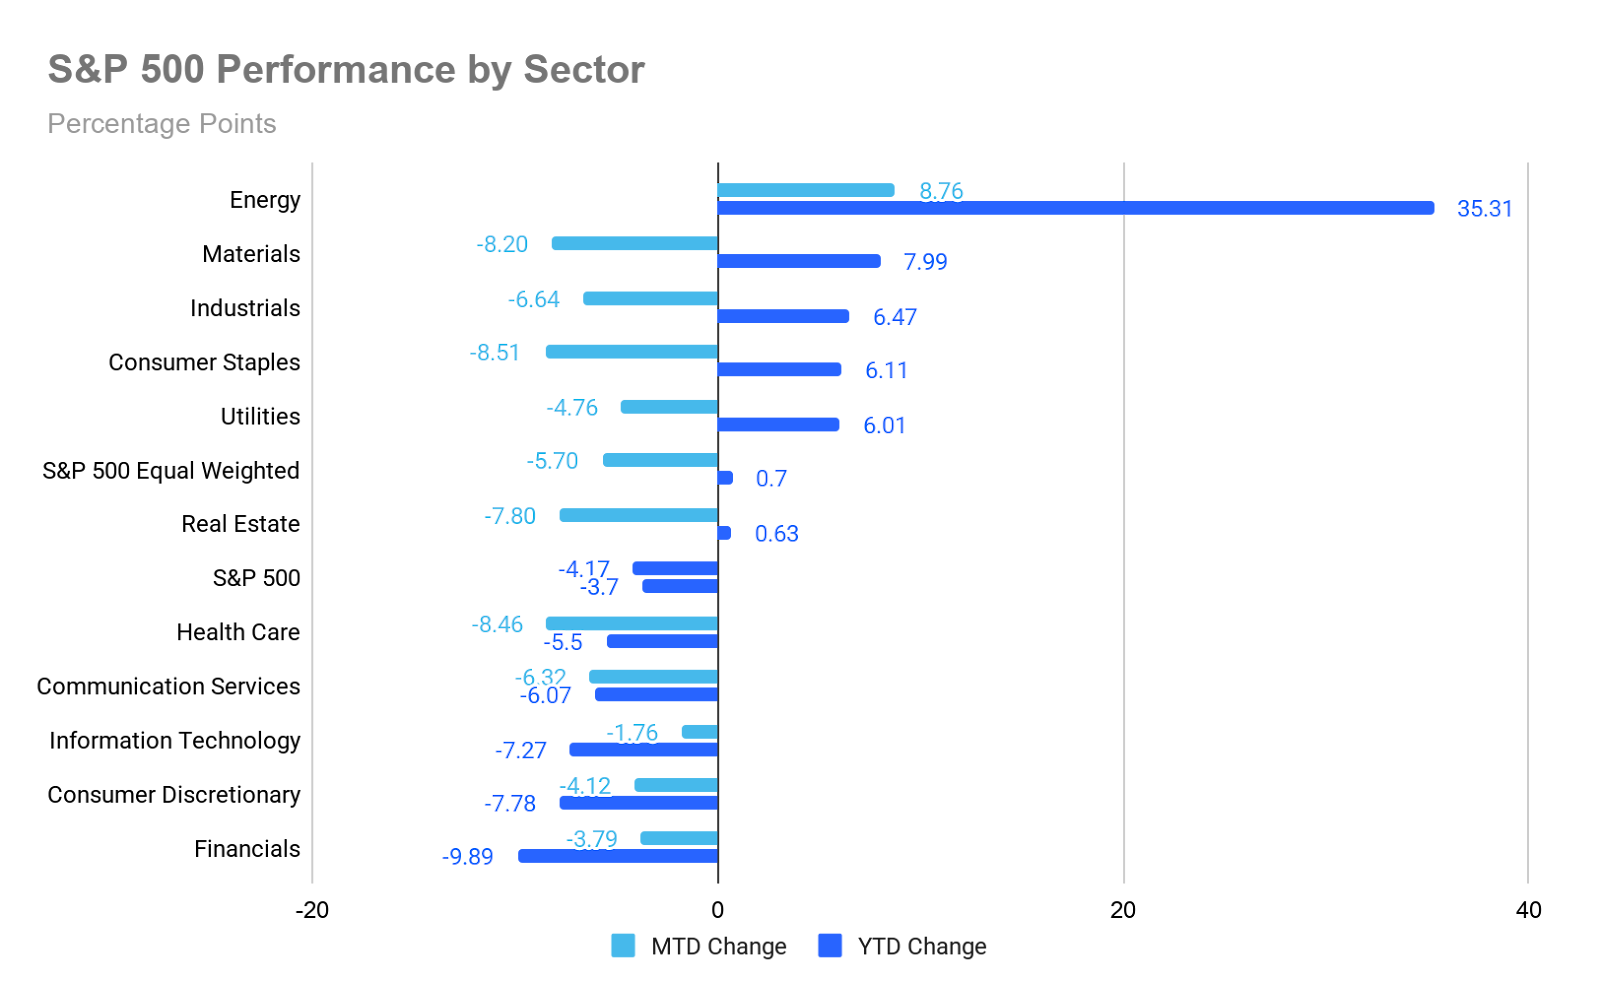
The Equally Weighted version of the S&P 500 is -5.70% MTD so far in March, 1.53 percentage points lower than the benchmark.
The S&P 500 Energy sector is the top performer thus far in March at +8.76% MTD and +35.31% YTD, while Consumer Staples underperformed -8.51% MTD and +6.11% YTD.
The rise in technology shares on Wednesday propelled equity markets higher, offsetting the decline in energy stocks.
The S&P 500 rose +0.54%, the Nasdaq Composite advanced +0.77%, and the Dow Jones Industrial Average was +0.66%. Wednesday’s trading session reflected a significant rotation, as every sector of the S&P 500, with the exception of Energy and Real Estate, reported gains.
The ongoing conflict between the US and Iran remained a central concern. While uncertainty endures regarding a potential ceasefire, markets have responded positively to any sign of progress.
In corporate news, a New Mexico jury determined on Tuesday that Meta Platforms was liable for failing to safeguard young people from online risks.
JetBlue Airways is reportedly exploring the possibility of a sale to a competitor, according to sources cited by Semafor.
Merck & Co. has agreed to acquire Terns Pharmaceuticals for $6.7 billion, thereby gaining access to a promising new treatment for leukaemia as it approaches the patent expiry of its top-selling cancer medication.
Europe:
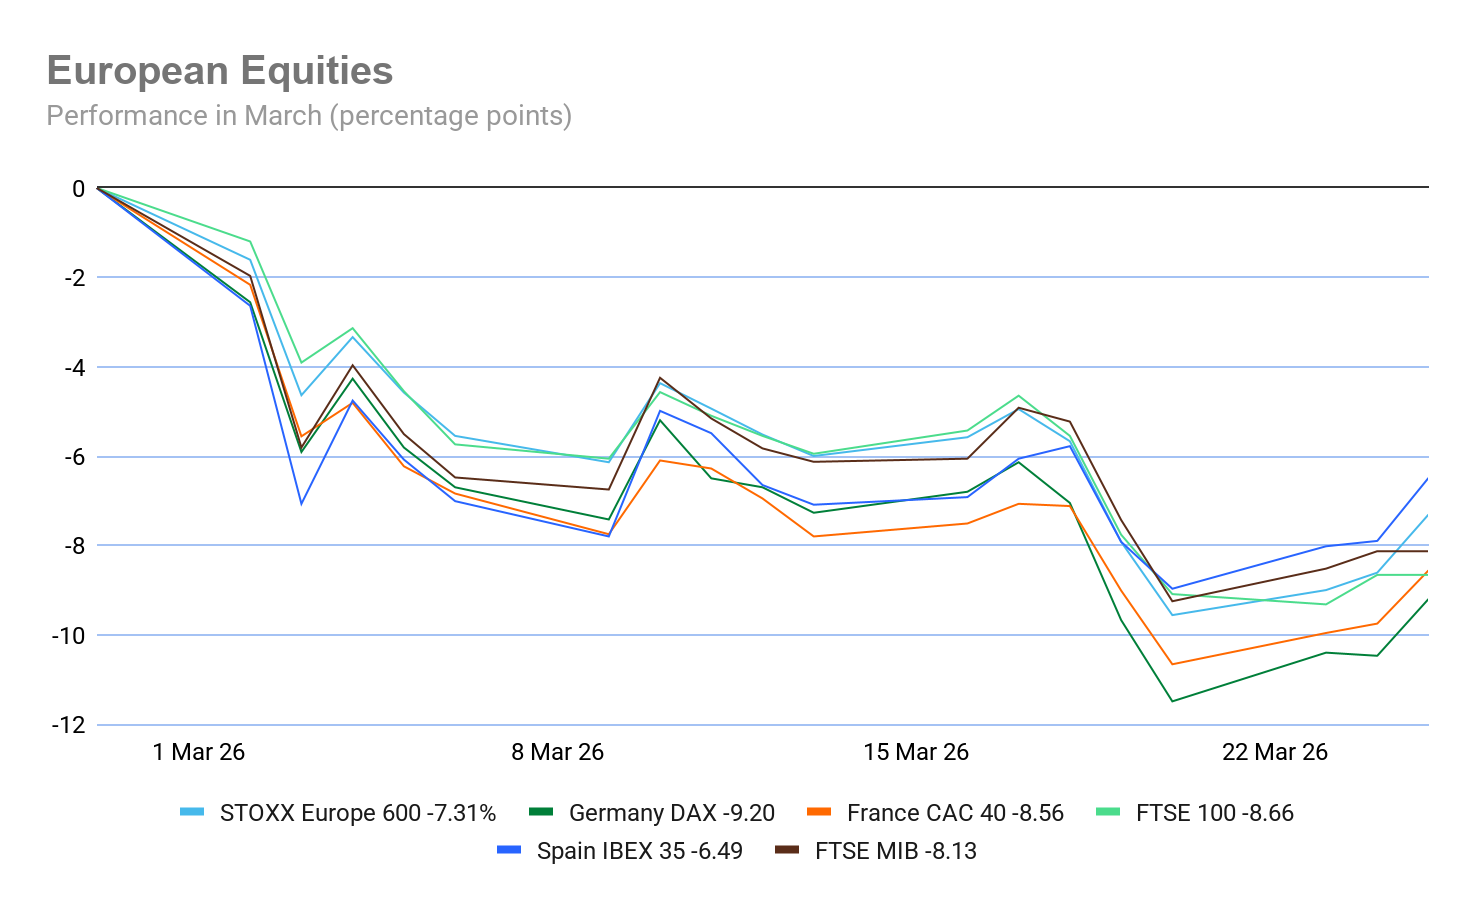
Stoxx 600 -7.31% MTD and -1.44% YTD
DAX -9.20% MTD and -6.26% YTD
CAC 40 -8.56% MTD and -3.72% YTD
FTSE 100 -8.66% MTD and +0.34% YTD
IBEX 35 -6.49% MTD and -0.80% YTD
FTSE MIB -8.13% MTD and -3.50% YTD
Source: FactSet
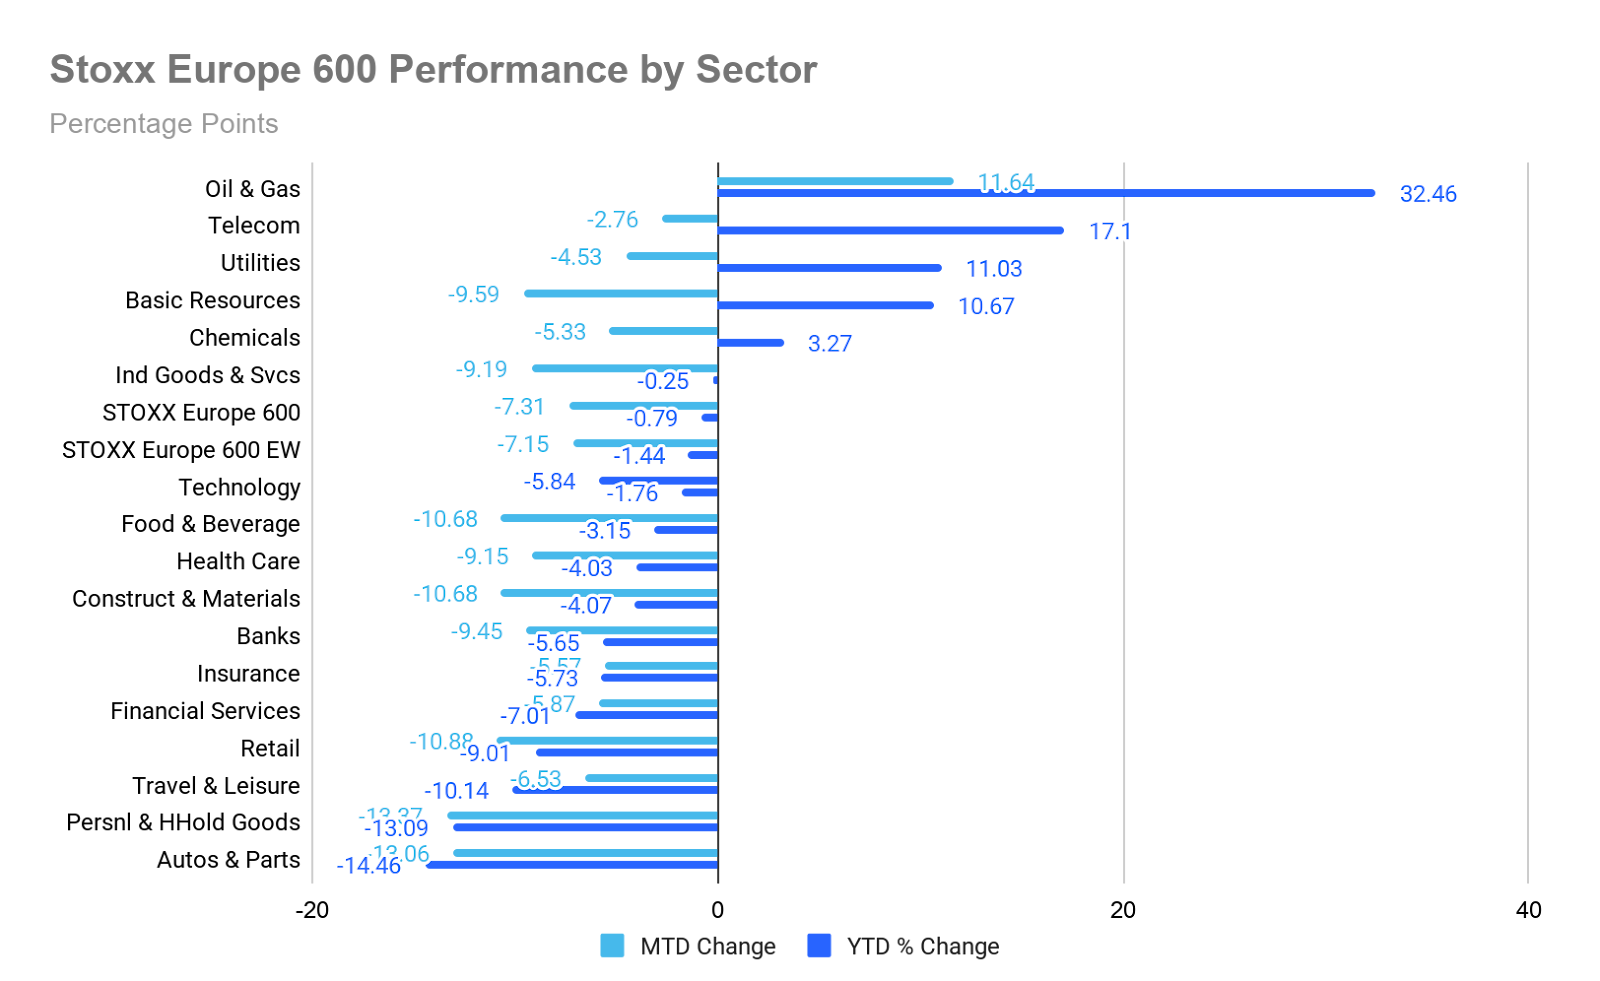
In Europe, the Equally Weighted version of the Stoxx 600 is -7.15% MTD, 0.16 percentage points higher than the benchmark.
The Stoxx 600 Oil & Gas is the leading sector, +11.64% MTD, and +32.46% YTD, while Personal & Household Goods exhibited the weakest performance at -13.37% MTD and -13.09% YTD.
On Wednesday, Cyclical sectors outperformed, with Basic Resources benefitting as industrial metals like copper rebounded on improved demand signals from China and easing of geopolitical risk premium. Travel and Leisure traded higher, as a lower perceived tail-risk for air travel and easing concerns over fuel costs, amid hopes of an Iran ceasefire, provided a boost to airlines and travel-related companies.
Industrial goods and services were well bid, supported by upgrades and positive corporate updates. TT Electronics, SIG Combibloc Group, and Stadler Rail all advanced. The construction and materials sector also outperformed, with Kingspan trading higher following RBC initiation, and Crest Nicholson benefitting from positive sales momentum.
The Chemicals sector outperformed, led by Lanxess, following a rating upgrade from JPMorgan, driven by enhanced pricing power and signs of early-cycle demand recovery. Technology showed selective strength, with Prosus gaining on the back of a Morgan Stanley upgrade tied to valuation upside and exposure to AI. Focus on reports that Arm Holdings plans to sell its own chips, aiming for annual revenue of $15 billion within five years.
Oil and Gas underperformed relative to the broader market, as a sharp pullback in crude prices weighed on the sector, despite constructive longer-term broker perspectives. Analysts caution that there remains a structural repricing risk should conflict in the Middle East re-escalate. An Equinor and a Shell-backed group is urging the EU to lift its ban on Arctic drilling.
Defensive sectors underperformed, with Telecom under pressure due to stock-specific developments, including contract terminations affecting INWIT and Orange entering exclusive negotiations with Verdoso for the potential divestment of Globecast. Food and Beverage, Utilities, Healthcare, and Personal and Household Goods also underperformed relative to the broader market, although they traded higher on the day as risk appetite improved.
Global:
MSCI World Index -6.10% MTD and -3.42% YTD
Hang Seng -4.86% MTD and -1.15% YTD
Mega cap stocks have had a mostly negative performance MTD as concerns surrounding valuation levels remain. Thus far in March, Nvidia +0.84%, and Amazon +0.81%, while Tesla -4.11%, Apple -4.38%, Microsoft -5.53%, Alphabet -6.68%, and Meta Platforms -8.22%.
Energy stocks experienced a positive performance so far in March with the Energy sector up +8.76% MTD. So far in March, Apa Corp +36.06%, Marathon Petroleum +21.71%, Phillips 66 +17.47%, Occidental Petroleum +16.52%, ConocoPhillips +13.63%, Shell +11.70%, Chevron +9.85%, Halliburton +7.31%, and ExxonMobil +7.06%, while Baker Hughes Company -4.05%, and Energy Fuels -11.43%.
Materials and Mining stocks have had a mixed performance MTD in March. The Materials sector is -8.20% MTD. So far this month, CF Industries Holdings +28.70%, Celanese Corporation +25.47%, Yara International +9.88%, and Albemarle +1.52%, while Mosaic -5.93%, Nucor Corporation -6.62%, Freeport-McMoRan -16.14%, Newmont Mining -21.91%, and Sibanye Stillwater -28.33%.
Commodities
Gold prices advanced by less than one percent on Wednesday, as ongoing uncertainty regarding the Middle East conflict persisted, continuing to fuel concerns about rising inflation expectations.
Spot gold recorded a gain of +0.70%, reaching $4,505.06 per ounce, following a decline to a four-month low earlier in the week on Monday.
The precious metal previously attained a record high of $5,594.82 per ounce on 29th January, but has since fallen by -14.94% from the end of February, coinciding with the onset of hostilities in Iran. Spot Gold is +4.43% YTD.
Spot silver edged up by +0.08% on Wednesday, trading at $71.28 per ounce. It is +0.03% so far this year.
Oil prices climbed by more than three percent on Wednesday, recovering from earlier losses in the trading day, when Brent futures had experienced a drop of up to seven percent. The increase followed Iran's ongoing assessment of a US proposal aimed at bringing an end to the conflict.
Brent crude futures ended the session up $3.29, or +3.29%, closing at $103.20 per barrel. Meanwhile, US WTI crude futures declined by $2.90, or -3.28%, to settle at $91.29 per barrel. Brent is +40.96% MTD and WTI +35.67% MTD. The extreme price fluctuations seen since the war broke out have elevated both crude benchmarks' historic volatility, measured by the actual 30-day close-to-close metric, to levels not seen since April 2022.
According to a senior Iranian official speaking to Reuters on Wednesday, Iran continues to evaluate the US proposal to halt the Gulf war, despite an initially unfavourable response. Tehran has, thus far, refrained from formally rejecting the initiative.
While Iranian authorities have publicly expressed strong opposition to the prospect of negotiations with the Trump administration, a delay in delivering a formal response to Pakistan, who presented a 15-point proposal on Washington’s behalf, suggests that some officials in Tehran may be giving the matter further consideration.
In a related development, India has purchased its first cargo of Iranian liquefied petroleum gas in several years, following the temporary removal of US sanctions on Tehran’s oil and refined fuels, according to sources.
Japanese Prime Minister Sanae Takaichi has appealed to International Energy Agency chief Fatih Birol for an additional coordinated release of oil stockpiles, as Tokyo seeks to protect consumers from escalating energy costs.
Contrary to some analysts’ expectations, the latest data from the US Energy Information Administration indicates that the United States did not begin withdrawing crude oil from its Strategic Petroleum Reserve during the week ending 20th March.
Additionally, Russia’s Baltic export terminals of Primorsk and Ust-Luga have suspended crude oil and oil product loadings following extensive Ukrainian drone attacks, which caused fires visible from Finland.
In Venezuela, oil production, including condensate and gas liquids, has reached 1.1 million barrels per day for the month of March.
EIA report. According to the EIA’s report released Wednesday, US crude oil refinery inputs averaged 16.6 million barrels per day during the week ending 20 March. This was 366 thousand barrels per day more than the previous week’s average, with refineries operating at 92.9% of their operable capacity. Gasoline production also increased last week, averaging 9.7 million barrels per day. In addition, Distillate fuel production increased by 158 thousand barrels per day last week, averaging 5.0 million barrels per day.
US crude oil imports averaged 6.5 million barrels per day last week, a reduction of
730 thousand barrels per day from the previous week. However, over the past four weeks, crude oil imports averaged about 6.6 million barrels per day, 15.5% more than the same four-week period last year.
US commercial crude oil inventories increased by 6.9 million barrels from the previous week to 456.2 million barrels. They are about 0.1% above the five year average for this time of year. Total motor gasoline inventories decreased by 2.6 million barrels from last week and are 3% above the five year average for this time of year. Both finished gasoline and blending components inventories decreased last week. However, Distillate fuel inventories increased by 3.0 million barrels last week and are about 0.4% below the five year average for this time of year. Total commercial petroleum inventories increased by 8.3 million barrels last week.
Currencies
The US dollar strengthened against major currencies on Wednesday, as traders appeared to have focussed on global inflation dynamics and remained sceptical of the prospects for de-escalation in the war in Iran.
The dollar index climbed +0.46%, reaching 99.64. The euro declined -0.44% against the dollar, settling at $1.1560, and the British pound declined -0.36% to $1.3362.
The US dollar index is +2.03% MTD and +1.38% YTD. Against the US dollar, the euro is -2.17% MTD and -1.58% YTD.
Earlier in the day, Sterling received limited support from domestic data indicating that UK consumer price inflation remained at an annual rate of 3% in February, unchanged from January. Inflation is expected to rise, as the surge in energy prices, fertiliser prices and chemicals are exerting upward pressure on prices. The British pound is -0.91% against the US dollar MTD and -0.82% YTD.
The US dollar advanced +0.50% against the Japanese yen to ¥159.40. Minutes released on Wednesday from the BoJ’s January policy meeting revealed that many board members considered further interest rate hikes necessary, though they did not specify the anticipated pace of increases. Japanese CPI for February came in below expectations at 1.3%, largely due to utility subsidies, but wages are still expected to increase over 5%. Core inflation did fall to 2.5% in February from January’s 2.6% but this is still above the BoJ 2% target. The yen is -2.14% MTD and -1.76% YTD.
Cryptocurrencies
Bitcoin +8.45% MTD and -19.02% YTD to $71,309.88
Ethereum +12.61% MTD and -27.37% YTD to $2,168.02
Bitcoin was +1.01% and Ethereum was +0.72% on Wednesday. Bitcoin and Ethereum have seen a recovery in March as ongoing geopolitical uncertainties and potential renewed tariff fears significantly impacted risk assets. Despite the volatility experienced this month, ETF inflows have continued, suggesting institutional interest has not waned, even as retail sentiment remains shaky. However, traders will be looking to Friday’s expiration of $17 billion in digital assets options for indications of future movement. This expiration includes almost $15 billion in Bitcoin or nearly 40% of the $36.5 billion worth of Bitcoin open interest currently on the crypto derivative exchange Derbit. Despite the geopolitical uncertainties, energy market volatility and equity market softness generated by the war with Iran, Bitcoin has remained resilient, staying around the $70,000 level.
Note: As of 5:00 pm EDT 25 March 2026
Fixed Income
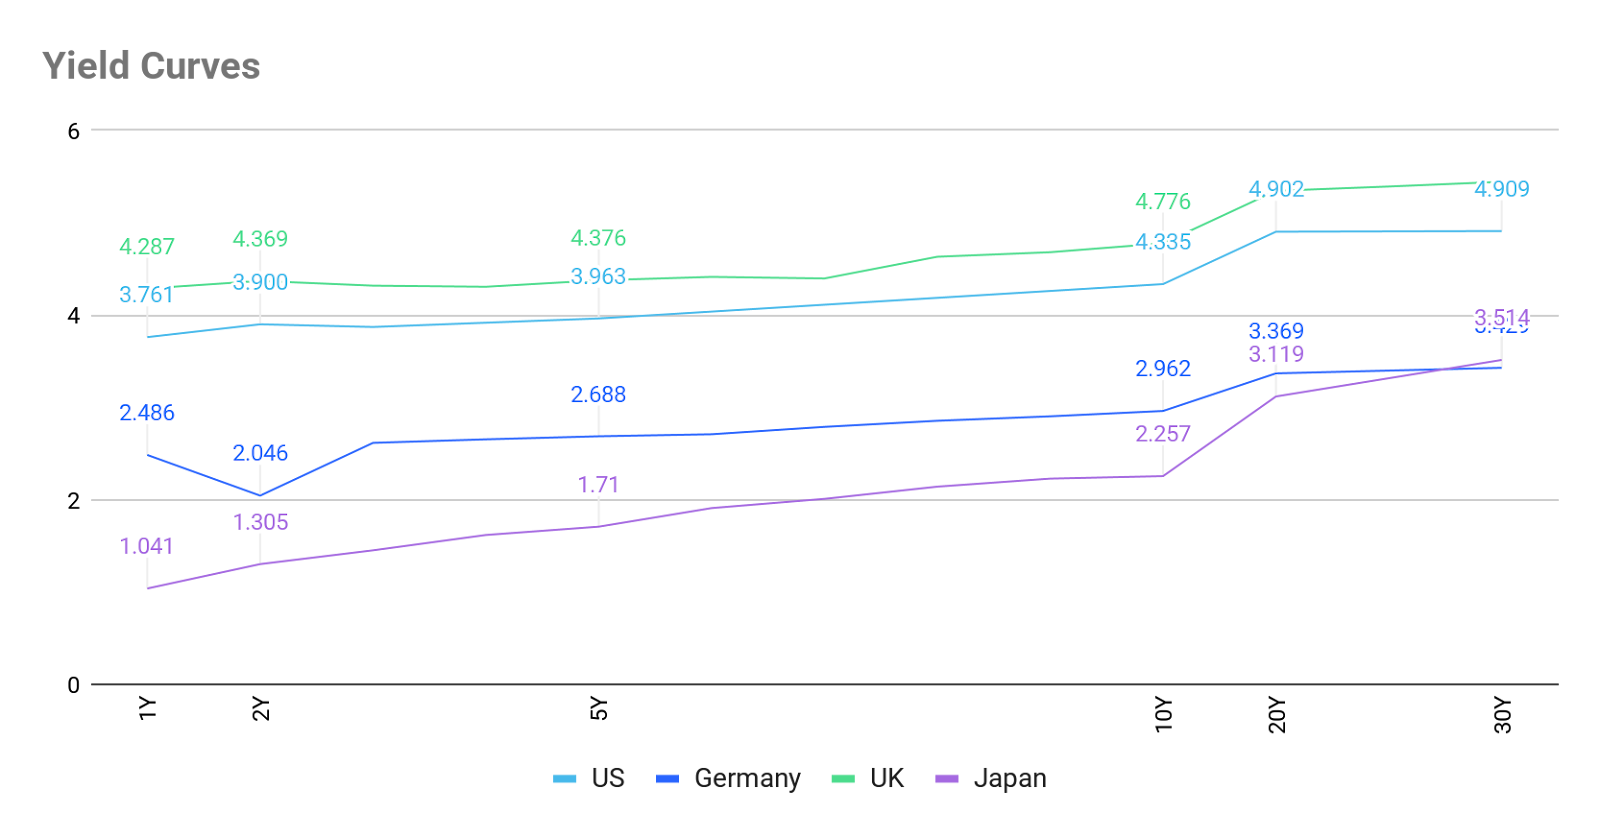
US 10-year yield +38.3 bps MTD +16.3 bps YTD to 4.335%
German 10-year yield +30.6 bps MTD +10.2 bps YTD to 2.962%
UK 10-year yield +42.0 bps MTD +29.8 bps YTD to 4.776%
US Treasury yields declined during Wednesday's trading session as Iran continued to evaluate a US proposal aimed at ending the conflict in the Middle East.
The yield on the 10-year Treasury was down by -3.4 bps, settling at 4.335%, while the two-year note yield fell by -2.7 bps to 3.900%. On the long-end of the curve, the 30-year yield decreased by -2.3 bps to 4.909%.
On Wednesday, the Treasury Department auctioned $70 billion in five-year notes, with a bid-to-cover ratio of 2.29x, falling short of the average 2.36x and the prior auction's 2.32x.
Yields on five-year notes initially spiked following the sale but subsequently retreated, last recorded at 3.963%.
The decline in yields early on Wednesday was attributed to reports that the US had proposed a peace plan to Iran and that Iran would allow certain vessels to transit the Strait of Hormuz, a crucial route for oil shipments.
The yield curve compressed on Wednesday, with the spread between the two- and 10-year yields dropping to 43.5 bps from 44.2 bps at the end of Tuesday’s session. Over the course of March, the US yield curve has bear-flattened with the spread between two- and 10-year yields narrowing by 13.0 bps, from 56.5 bps at the end of February to 43.5 bps on Wednesday.
The yield on the US 10-year Treasury note is +38.3 bps MTD for March. The US 30-year yield is +29.1 bps. At the short end, the two-year Treasury yield is +51.3 bps MTD.
Current sentiment in the Fed funds futures market, according to CME's FedWatch Tool, suggests a 5.2% probability of rates rising to the 3.75 - 4.00% range at the April FOMC meeting, higher than the 0.4% implied probability one month ago.
Source: FactSet
In the UK the 10-year gilt fell -17.6 bps to 4.776% on Wednesday. On the short end, the 2-year gilt was -15.5 bps lower to 4.369%. The UK's 30-year gilt yield declined -18.6 bps to 5.442%. In the UK, the 10 year gilt yield is +30.6 bps MTD. The UK 30 year is +40.4 bps so far in March.
Across the channel, eurozone bond yields declined on Wednesday as oil prices eased on signs of progress towards resolving hostilities, with Italian bonds leading the recovery after being among the most adversely affected since the onset of the conflict with Iran.
Germany's 10-year Bund yield fell -7.5 bps to 2.962%, marking its third consecutive daily decrease and representing the largest single-day drop since October. Italy's 10-year yield was -11.0 bps to 3.829%, resulting in a decrease of 3.5 bps of the spread between German and Italian 10-year yields to 86.7 bps.
Since the US and Israel initiated airstrikes on Iran on 28th February, the Italian 10-year bond yield has risen +47.9 bps, while the 10-year Bund yield has risen +30.6 bps. This is due to Italy’s greater reliance on fossil fuel imports compared to its neighbours amplifying its exposure to volatility in energy prices.
Germany’s two-year Schatz yield, sensitive to shifts in interest rate and inflation expectations, declined -6.9 bps to 2.611%. On the long end, the 30-year Bund yield was -6.5 bps at 3.429%.
Market participants are currently pricing in a 65% probability of a 25 bps rate hike at the ECB’s next meeting. Additionally, expectations point to 66.0 bps of tightening throughout the year, implying at least two quarter-point increases by December.
The German 10-year yield is +30.6 bps MTD for March. The spread between US 10-year Treasuries and German Bunds stands at 136.4 bps, reflecting a widening of 7.7 bps over the month so far, from 128.7 bps at the end of February.
The 2-year Schatz is +59.5 bps MTD and the German 30-year yield is +11.0 bps MTD.
France’s 10-year OAT yield was bps to +34.0 MTD. The spread of French government bonds versus German Bunds has increased by 3.4 bps over the month to 68.9 bps, from 65.5 bps at the end of February.
During March the spread of Italian 10-year BTPs over Bunds has widened by 17.3 bps so far. The Italian 10-year BTP yield has increased by +47.9 bps MTD.
Lagarde outlines principles for response to the Iran conflict. At the ECB Watchers Conference, officials addressed the central bank's approach to the shock arising from the ongoing conflict in Iran. President Christine Lagarde emphasised the ECB's readiness to respond, while noting that a thorough assessment of the situation is still underway. She outlined three guiding principles for the ECB's decision-making: firstly, determining whether the energy shock remains contained; secondly, evaluating if the shock results in a significant but not overly persistent overshoot of inflation; and thirdly, considering whether an unaddressed overshoot would pose a risk to the ECB's communication strategy.
Chief Economist Philip Lane observed that, in the baseline scenario, indirect and second-round effects from the conflict are expected to be limited, although he cautioned that prolonged or severe disruptions to energy supplies could affect broader price levels. Governing Council member Martins Kazaks remarked that, should inflation become more entrenched and begin spreading across various sectors, an early policy adjustment may be warranted.
Following last week's rate decision, ECB sources indicated that policy tightening would be discussed at the late April meeting, though a near-term rate hike remains uncertain. Some policymakers have expressed concerns that subdued demand may call for caution, yet memories of the previous inflation shock continue to influence their deliberations.
Note: As of 5:00 pm EDT 25 March 2025
What to think about in April 2026
The US-Iran conflict that erupted on 28th February has compressed a multi-year tail risk into a single quarter, delivering a supply shock whose breadth extends far beyond crude oil. The Strait of Hormuz, through which approximately one fifth of global seaborne oil and one-third of global seaborne fertiliser trade, now operates at roughly five percent of its pre-war daily traffic. This is a near-total interruption that is simultaneously repricing energy, food, and industrial inputs. The damage is structural in certain sectors, not merely cyclical. The recovery timelines in several supply chains will extend well beyond the conflict itself.
The fertiliser complex was already strained entering 2026. Sanctions against Russia and Belarus had already removed a quarter of Europe's traditional supply; China has been prioritising domestic supply of their fertiliser over exports, resulting in a 90% y/o/y decrease in nitrogen fertiliser exports. The war has laid a fresh shock on top: urea prices jumped from $482/ton to $720/ton in under three weeks, while granular urea in New Orleans hit multi-year highs. Phosphates, potash, sulfur, and ammonia have all repriced in tandem. The implications run directly into 2026 planting economics, sustaining food-CPI pressure through 2027.
The petrochemical disruption is arguably deeper. Roughly half of global polyethylene (PE) capacity is either directly offline or indirectly feedstock-constrained. The retaliatory strike on Qatar's Ras Laffan facilities removed 77.4 million tonnes per year of LNG-linked and derivative capacity, with the site carrying a 3 to 5 year recovery timeline. Polypropylene (PP), PVC, and benzene have all surged 50% to 80% in some markets in under four weeks. The full cost stack, from crude to naphtha, which is primarily used as a petrochemical feedstock to produce olefins, to cracked olefins, which are versatile building blocks vital for creating plastics, synthetic rubbers, and chemicals, has repriced simultaneously, eliminating the regional arbitrage that procurement strategies historically relied on. The naphtha-dependent crackers, those petrochemical facilities that use naphtha as their primary feedstock to produce olefins like ethylene and propylene, across Taiwan, South Korea, Singapore, and Indonesia, which might ordinarily fill the European supply gap, are themselves feedstock-constrained, precluding near-term substitution.
As a result, investors in plastics converters, packaging, construction materials, automotive, and agricultural chemicals should model a delay further than six months in margin recovery even under a prompt ceasefire scenario, given that production restarts, insurance normalisation, and infrastructure repair compound the restart timeline beyond the diplomatic one.
The farm-to-fork transmission is well underway. Higher bunker fuel costs raise shipping rates, which elevate the landed cost of imported wheat, animal feed, and palm oil, which then flows through to bread, poultry, and pork. The geopolitical risk premium is now fully embedded in the food-energy-freight nexus, threatening 2026 food inflation in import-dependent economies.
The divergence in policies across the major central banks reflects fundamentally different energy matrices and inflation transmission channels. The Fed entered this shock from the most insulated position. The US is a net energy exporter and the direct passthrough from crude to core PCE is materially lower than in Europe or Japan. The Fed's March dot plot retained a single 25 bps cut for 2026, but Fed Chair Powell explicitly conditioned it on inflation progress that may not now happen. However, the stagflation dilemma is real and the FOMC's 11-1 vote to hold at 3.50% – 3.75% appears to reflect genuine uncertainty rather than conviction.
The ECB faces a structurally more difficult calculus. Europe's energy import dependence means oil and gas price spikes translate almost mechanically into headline inflation, even as demand destruction from the same shock suppresses activity. The BoJ is in a uniquely complex position. As Japan relies almost entirely on imported oil and gas, the present shock exerts a deflationary effect on real incomes while simultaneously exerting upward pressure on headline inflation. Governor Ueda has emphasised that sustainable price increases must be supported by strong wage growth; inflation driven by rising energy costs alone is not desirable.
A rising dollar is not a side effect in this scenario, it is an active transmission mechanism that compounds the inflation impulse across Emerging Markets (EM) while paradoxically dampening it within the US. For energy-importing EMs, a strong dollar means higher local energy costs since oil is priced in USD, amplifying price increases beyond those in dollars alone. The dollar's safe-haven bid thus delays rather than prevents EM rate cuts, extending the restrictive monetary cycle globally.
The business cycle will not turn uniformly. The US, shielded by energy self-sufficiency and a stronger dollar, retains a more limited impact, although the labour backdrop is already fragile and is more susceptible to stagflation. Europe, more exposed to energy passthrough and trade disruption, risks a demand recession that the ECB cannot easily offset without reigniting inflation. Japan faces the most complex policy path, with cost-push inflation threatening to hollow out the very wage-growth cycle the BoJ has spent a decade trying to engineer. Sectors whose supply chains run through the Gulf such as fertilisers, nitrogen chemicals, polyolefins, PVC, and benzene derivatives, should be modelled with recovery assumptions shifted outwards to a longer time frame, for example, six to eighteen months, independent of when conflict is resolved by the diplomatic calendar.
Key events in April 2026
The potential policy and geopolitical risks for investors that could affect corporate earnings, stock market performance, currency valuations, sovereign and corporate bond markets and cryptocurrencies include:
12 April Legislative elections, Hungary. The elections are expected to be a closely contested race between the ruling Hungarian Civic Alliance (Fidesz) and the centrist Respect and Freedom Party (Tisza). The election will be critical due to Prime Minister Viktor Orbán’s contrarian role within the EU, his stance on Ukraine, and his close ties with Russia and China.
13-19 April IMF and World Bank Spring Meetings, Washington, DC, USA. Finance ministers, central bank governors, and other officials from around the world will gather to discuss the global economic outlook, financial stability, economic development, and policies to address economic challenges.
27 April - 22 May The 2026 Review Conference of the Parties to the Treaty on the Non-Proliferation of Nuclear Weapons, New York, USA. The 2026 Review at the UN Headquarters in New York will provide an indication on international perspectives on non-proliferation. This will likely prove particularly lively given the war with Iran and its attempts to build nuclear weaponry.
27-28 April Bank of Japan Monetary Policy Meeting and Outlook Report. The BoJ may choose to raise rates at this meeting, but much will depend on the progression of the war with Iran. However, sticky core inflation, stronger-than-expected PMI figures in March, and positive wage negotiations appear to raise the odds of an April hike.
28-29 April Federal Reserve Monetary Policy Meeting. The Fed is widely expected to hold rates again at this meeting as it balances the risks of rising inflation resulting from the war with Iran against further weakening in the labour market.
29-30 April ECB Monetary Policy Meeting. Although it has been suggested by some ECB policymakers that the ECB will tighten rates in response to inflationary pressures, it is likely to wait until there is greater clarity around when the war with Iran will end and whether the inflationary impacts of the energy price surge will be more transitory or not.
30 April Bank of England Monetary Policy Meeting, Minutes, and April Monetary Policy Report. The BoE will likely keep rates on hold again in April as it awaits the outcome of the war with Iran. Inflation is expected to continue to tick higher this year, but with the labour market continuing to soften and growth also weakening, it will be a fine balance for the MPC.
While every effort has been made to verify the accuracy of this information, EXT Ltd. (hereafter known as “EXANTE”) cannot accept any responsibility or liability for reliance by any person on this publication or any of the information, opinions, or conclusions contained in this publication. The findings and views expressed in this publication do not necessarily reflect the views of EXANTE. Any action taken upon the information contained in this publication is strictly at your own risk. EXANTE will not be liable for any loss or damage in connection with this publication.
This article is provided to you for informational purposes only and should not be regarded as an offer or solicitation of an offer to buy or sell any investments or related services that may be referenced here. Trading financial instruments involves significant risk of loss and may not be suitable for all investors. Past performance is not a reliable indicator of future performance.


Created by professionals. For professionals.
