
Is the tech meltdown real?

Global Macro Updates
Melt or mirage? Navigating the AI trade, rising rates and the Hectocorn pipeline. The most recent earnings season offered more than headline beats; it drew a structural map of the AI infrastructure stack, and for the first time, it was one grounded in actual conversion rather than forward promises. As we covered in our Equity Monthly Review, within the AI complex itself, the rotation from compute toward power and materials signalled a market searching for portions of the chain where value had not yet been fully capitalised.
Against that constructive backdrop, the last few trading sessions have shaken investor confidence in the AI complex. The structural overhang, however, runs deeper than the tape. With strong US payroll data renewing rate-hike expectations and the 10-year Treasury yield back above 4.550%, the financing calculus for AI companies has shifted materially. These companies are increasingly funding infrastructure through the bond market and surpassing US banks as the largest segment in the JP Morgan IG index. As rates rise, that debt becomes more expensive to service and to roll, a headwind for issuers whose earnings are still years away from covering their capital programmes.
Credit market dynamics add a second constraint. Fixed-income diversification rules cap exposure to any single issuer well below the concentration levels permissible in equities, meaning AI companies cannot rely on bond markets for unlimited capital absorption. The alternative, equity issuance, brings its own complications: it dilutes existing holders and introduces governance uncertainty, particularly for companies with dual-class structures that investors are still learning to price. CapEx monetisation and the durability of AI-related profits remain the key overhangs.
The pressure is not only financial; it is also emerging from the demand side of the model ecosystem. According to NavyAI Research, token prices have fallen roughly 99.7% in per-unit terms since GPT-3-era rates, yet enterprise AI bills have tripled over the same period. Agentic workflows multiply token consumption 50 – 500 times per task, and the majority of production AI cost sits outside the model invoice entirely, in orchestration, retrieval and observability layers.
This tension has become commercially acute. Uber burned through its entire 2026 AI budget within four months after deploying Anthropic's Claude Code across roughly 5,000 engineers and then, crucially, its COO stated that drawing a direct line between AI usage and tangible productivity gains was ‘not there yet’. Microsoft revoked developer Claude Code licences months after enabling them. In response, OpenAI is reportedly considering drastic price cuts in anticipation of a user-acquisition war with Anthropic, even as both firms prepare for IPOs. This competitive repricing strips out margin and raises questions about the revenue quality that public-market investors will be asked to price.
Goldman Sachs projects global token usage to multiply 24x by 2030, which makes the demand trajectory irreversible in aggregate. However, the transition from unbounded experimentation to disciplined, ROI-measured deployment is deflationary for token-revenue growth in the near term. The CapEx and monetisation overhang now has a direct corporate-level counterpart in token budget governance.
A structural test for capital markets. The AI-linked weakness arrives precisely as public markets face their most consequential capital absorption event in a generation. SpaceX, OpenAI and Anthropic collectively represent an IPO pipeline valued at approximately $3.6 trillion, a cohort being labelled ‘hectocorns’ for their $100 billion-plus valuations that dwarf anything the IPO market has processed before. SpaceX alone targets a $1.75 – $1.80 trillion valuation, pricing at $135 per share to raise $75 billion in what would be the largest IPO in history, with Nasdaq listing set for 12 June. Anthropic has just filed confidentially at a $965 billion valuation following a $65 billion Series H, while OpenAI has separately filed confidentially ahead of a likely H2 offering.
The passive-flow implications of these listings have already reshaped index governance. Nasdaq amended its rules to allow companies ranking in the top 40 market caps to gain Nasdaq 100 inclusion within 15 trading days of their IPO; FTSE Russell adopted a fast-entry rule allowing Russell 1000 inclusion after just five trading days for companies meeting the top 500 market-cap threshold. S&P Dow Jones Indices, however, declined to change its eligibility criteria on 4 June, preserving the 12-month seasoning period and the requirement for four consecutive quarters of positive GAAP earnings. Under current rules, SpaceX's earliest S&P 500 inclusion is mid-2027 at best.
Damodaran's dissent. The SpaceX offering has attracted perhaps its most rigorous public scrutiny from Aswath Damodaran, Professor of Finance at the Stern School of Business at NYU, who published a post-prospectus valuation update after the S-1 became available on 20 May. Damodaran's analysis treats SpaceX as three distinct businesses, space launch, Starlink connectivity and xAI. His central concern is that the company's prospectus claims a total addressable market of $28 trillion, of which $26 trillion is attributed to AI, a figure he characterises as ‘borders on fantasy’ and comparable in spirit to the inflated TAM disclosures seen in the Uber and Airbnb IPOs a decade ago.
On the operating data, Damodaran found that Starlink remains the financial spine of the company; connectivity revenues grew nearly 50% in 2025 and the business was the only segment generating positive operating income before capitalisation of R&D. The AI segment, by contrast, reported deteriorating gross margins, reflecting the intense competitive pressure and the rising costs of delivering AI products, the same dynamics now compressing margins across the sector. The 2025 net loss was $4.94 billion against revenues of $18.67 billion. CapEx plus R&D reached nearly $23 billion for the year, doubling from 2024.
Damodaran's revised post-prospectus intrinsic value for SpaceX equity sits at approximately $1.25 – $1.30 trillion, roughly 28% – 31% below the $1.80 trillion offering price, a gap he attributes largely to the AI segment's overestimated target market and compressed margin prospects. He notes that the offering price implies roughly 93x LTM Revenue, a multiple that cannot be assessed on earnings since the company is loss-making. Critically, the dual-class share structure leaves Elon Musk with over 85% of voting rights, meaning that if the AI ambitions prove misplaced and CapEx continues to accelerate into a smaller-than-projected market, shareholders have limited recourse. According to Damodaran, SpaceX is ‘a loaded bet on AI and Elon Musk’, and while the track record with Tesla gives some investors comfort, the structural governance risk is not priced into a $1.80 trillion offering.
At the macro level, the re-pricing of rate expectations, driven by a labour market stronger than consensus anticipated, threatens to widen discount rates for long-duration AI assets precisely as their terminal cash flows remain the most speculative. At the corporate level, the productivity-monetisation gap is widening: enterprises are rationalising token spend and the first generation of agentic deployments is producing bugs and rewrites at a rate that clouds the ROI case. At the capital markets level, the combined absorption of SpaceX, OpenAI and Anthropic, even staggered across H2 2026, represents a demand for institutional and passive equity capital that competes directly with the existing AI-infrastructure cohort for allocation.
The investor's task is less to decide whether the AI build-out is real than to assess, with more discipline than markets have required to date, which layers are priced to perfection and which retain a margin of safety. The Hectocorn pipeline demands that question be answered with unusual urgency.
Global market indices
US Stock Indices Price Performance
Nasdaq 100 -6.02% MTD and +12.90% YTD
Dow Jones Industrial Average -2.18% MTD and +3.86% YTD
NYSE -0.91% MTD and +4.89% YTD
S&P 500 -4.13% MTD and +6.16% YTD
The S&P 500 is -3.80% over the past seven days, with 6 of the 11 sectors down MTD. The Equally Weighted version of the S&P 500 is -1.30% over this past week and +7.49% YTD.
The S&P 500 Energy is the leading sector so far this month, +3.46% MTD and +28.69% YTD, while Information Technology is the weakest sector at -7.97% MTD and +13.69% YTD.
Over the past seven days, Consumer Staples outperformed within the S&P 500 at +3.99%, followed by Health Care and Real Estate at +3.71% and +3.28%, respectively. Conversely, Information Technology underperformed at -9.64%, followed by Materials and Industrials at -4.04% and -3.69%, respectively.
The equal-weight version of the S&P 500 was -1.31% on Wednesday, outperforming its cap-weighted counterpart by 0.31 percentage points.
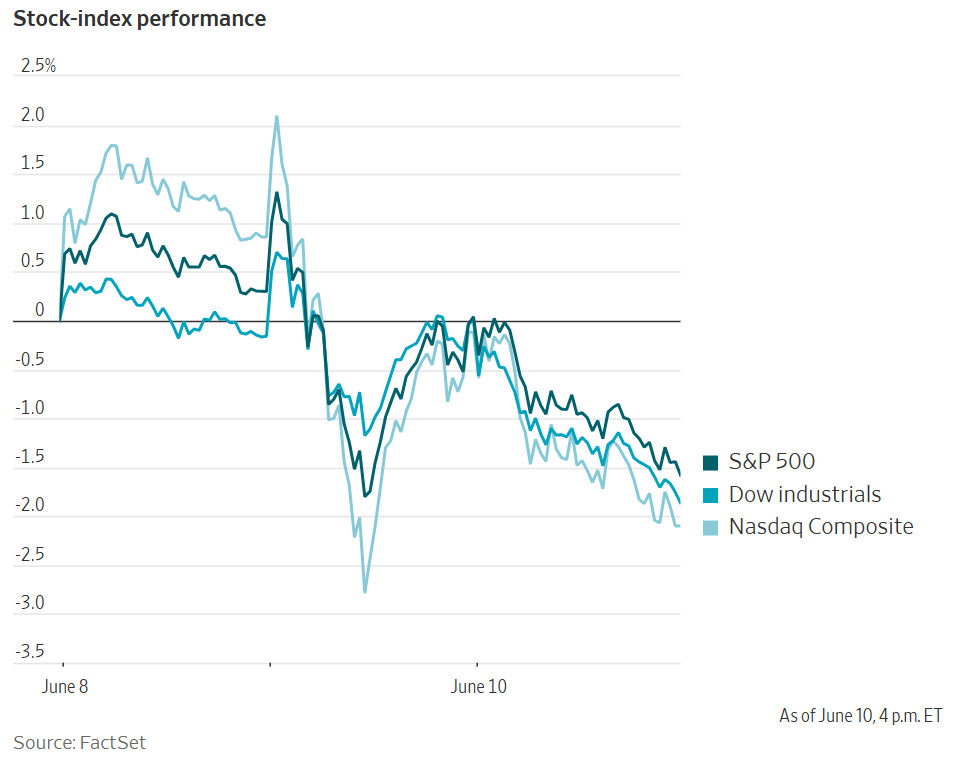
On Wednesday, markets fell after a renewed selloff in technology companies as investors became more nervous about AI valuations. The VIX Index, often referred to as Wall Street’s ‘fear gauge’, climbed 2.4 points to 22.20, above its long-term average of 20. In addition, rising tensions in the Middle East after the US President’s threat of retaliation against Iran lifted oil prices.
Those concerns drove the S&P 500 to a five-week low. The S&P 500 was -1.62%, or down 119.66 points, to 7,266.99. The Dow Jones Industrial Average was -1.87%, or down 953.33 points, to close at 49,918.78, its worst day since October. The Nasdaq Composite was -1.98%, or down 509.32 points, to 25,169.50. Over the past seven days, the S&P 500 was -3.80%, the Dow Jones Industrial Average was +0.37% and the Nasdaq Composite was -6.27%.
In corporate news, Super Micro Computer’s shares fell almost thirty percent the day after the company announced a plan to raise $7 billion through a share offering intended to help pay for the production of more AI servers.
Oracle posted profit of $4.3 billion, or $1.45 per share, as strong growth in its cloud business more than offset a two percent decline in software revenue. Remaining performance obligations rose 4x y/o/y to $638 billion, supported by AI contracts. The company also reaffirmed its fiscal 2027 revenue target of $90 billion and raised its adjusted EPS guidance to $8.05.
Mega caps: The Magnificent Seven had a negative performance over the past week. Over the last seven days, Alphabet -0.73%, Amazon -4.81%, Apple -6.31%, Nvidia -6.67%, Microsoft -7.02%, Meta Platforms -8.35% and Tesla -9.94%.
Energy stocks had a largely negative performance this week. The Energy sector itself was -0.79%. WTI and Brent prices are -4.52% and -3.20%, respectively, over the past week. Over the last seven days, ConocoPhillips +0.73% and Chevron +0.05%, while APA -0.58%, Shell -0.90%, BP -0.92%, ExxonMobil -1.25%, Marathon Petroleum -1.47%, Phillips 66 -1.60%, Baker Hughes -1.94%, Halliburton -3.61%, Occidental Petroleum -4.26% and Energy Fuels -23.92%.
Materials and Mining stocks had negative performance this week, with the Materials sector itself -4.04%. Over the past seven days, Nucor -2.81%, CF Industries -6.30%, Yara International -8.93%, Celanese Corporation -9.19%, Freeport-McMoRan -12.12%, Albemarle -11.13%, Mosaic -13.45%, Newmont Corporation -14.36% and Sibanye Stillwater -17.22%.
European Stock Indices Price Performance
Stoxx 600 -1.25% MTD and +4.39% YTD
DAX -3.62% MTD and -1.20% YTD
CAC 40 -0.26% MTD and +0.15% YTD
IBEX 35 -1.20% MTD and +4.82% YTD
FTSE MIB +0.45% MTD and +11.83% YTD
FTSE 100 -1.48% MTD and +3.26% YTD
This week, the pan-European Stoxx Europe 600 index is -0.49%. It was -0.08% on Wednesday, closing at 618.17.
So far this month in the STOXX Europe 600, Retail is the leading sector +2.43% MTD and -1.54% YTD, while Basic Resource is the weakest at -5.68% MTD and +21.28% YTD.
Over the past seven days, Personal & Household Goods outperformed within the STOXX Europe 600, at +4.15%, followed by Health Care and Food & Beverages at +3.67% and +2.76%, respectively. Conversely, Basic Resource underperformed at -8.01%, followed by Telecom and Industrial Goods & Services at -4.30% and -2.93%, respectively.
Germany's DAX index was -0.97% on Wednesday, closing at 24,195.31. It was -2.42% over the past seven days. France's CAC 40 index was -0.51% Wednesday, closing at 8,161.83. It is +0.14% over the past week.
The UK's FTSE 100 index was -0.75% over the past week to 10,254.81. It was +0.27% on Wednesday.
On Wednesday, European equities were led by the Food & Beverage and Real Estate sectors, as investors rotated toward defensives and reduced exposure to more cyclical sectors. Insurance and Telecom also attracted safe-haven inflows, while stabilising bond yields provided support for yield-sensitive sectors such as Telecom and Real Estate. Travel & Leisure traded higher, aided by lower crude prices and strength in hospitality names. Fuller, Smith & Turner advanced following an upbeat full-year guidance and constructive analyst commentary, although WH Smith shares fell after issuing a profit warning, citing uncertainty related to the Middle East conflict and weaker performance in North America.
In contrast, Basic Resources underperformed as cyclical and commodity-linked stocks came under pressure amid weaker metal prices, even as crude oil remained broadly stable following the latest escalation in tensions between the US and Iran. Technology extended its recent pullback, reflecting continued volatility across global AI-related names. At the individual stock level, STMicroelectronics outperformed after Bank of America upgraded the shares to Buy, whereas SOITEC declined sharply after Jefferies downgraded the stock to Underperform, arguing that its 500% YTD rally had detached from underlying fundamentals.
Financial Services and Banks also underperformed, as investors continued to assess developments involving UniCredit and Commerzbank after the Italian lender increased its stake in the German bank. Commerzbank’s challenge to the composition of tendered shares kept the situation in focus. Industrial Goods & Services likewise traded lower, led by a sharp decline in Kongsberg Gruppen following its capital markets day, where the company outlined ambitious long-term revenue targets. The sector was also weighed down by profit-taking in data centre-related names, including Siemens and Prysmian.
Other Global Stock Indices Price Performance
MSCI World Index -3.73% MTD and +5.70% YTD
Hang Seng -3.08% MTD and -4.77% YTD
Over the past seven days, the MSCI World Index and Hang Seng Index are -3.39% and -4.78%, respectively.
Currencies
EUR -1.08% MTD and -1.81% YTD to $1.1532
GBP -0.65% MTD and -0.79% YTD to $1.3367
The US dollar edged higher on Wednesday after data showed that consumer inflation accelerated in May to its highest level in three years, broadly in line with market expectations.
The dollar index rose +0.06% to 100.05, remaining close to the two-month high of 100.21 reached on Monday, while the euro slipped -0.04% to $1.1532. Over the past week, the dollar index is up +0.52%. Against the greenback, the euro is down -0.57% over the past seven days.
Sterling was little changed, easing -0.01% against the dollar to $1.3367 as investors awaited Friday’s UK GDP data for further direction. Over the past week, the pound has declined by -0.37% against the US dollar.
Markets have largely priced in a BoJ rate increase at the 16 June policy meeting, suggesting that such a move alone is unlikely to trigger a meaningful reversal in yen weakness. Instead, investors appear to be looking for more hawkish guidance from BoJ Governor Kazuo Ueda, particularly any indication that the next rate increase could be brought forward from December to September, with scope for a third hike before year-end.
Against this backdrop, the yen weakened -0.07% to ¥160.46 per dollar, continuing to trade above the ¥160 threshold that many investors view as a potential trigger level for official intervention. Over the past week, the dollar has advanced +0.26% against the yen. Against the yen, the dollar is +0.75% MTD and +2.43% YTD.
BoJ faces a policy meeting without Governor Ueda. BoJ Governor Kazuo Ueda has been hospitalised for treatment of an infected liver cyst and will miss the central bank’s 15 to 16 June policy meeting, according to the BoJ. The governor is expected to remain in hospital for around two weeks, continue working remotely where needed, and return in time for the 30 to 31 July meeting.
Although markets still widely expect the BoJ to raise interest rates next week, his absence may complicate the bank’s communication around the policy outlook beyond June.
The BoJ said Governor Kazuo Ueda will submit a written policy statement, but will not participate in the vote. Deputy Governor Ryozo Himino will chair the meeting in his place, while Deputy Governor Shinichi Uchida is scheduled to deliver the post-meeting press conference.
At April’s meeting, three of the BoJ's nine board members voted in favour of hiking its short-term policy rate to 1.00% from 0.75%, and since then two more, Junko Koeda and Kazuyuki Masu, called for a near-term rate hike.
Note: As of 5:00 pm EDT 10 June 2026
Cryptocurrencies
Bitcoin -16.41% MTD and -30.10% YTD to $61,299.21
Ethereum -19.79% MTD and -45.95% YTD to $1,609.88
Bitcoin was -6.15% over the last seven days and Ethereum was -11.14%. On Wednesday, Bitcoin was -0.68% and Ethereum -2.37%. Cryptocurrencies continued to drop this week as investors pulled out of spot ETFs, there were major corporate liquidations and expected shifts in monetary policy, with markets pricing in one rate rise in the US this year and up to three in Europe. Bitcoin is down over 50% from its October 2025 record high and has moved below its 200-week moving average. As noted by Bloomberg news, for the first time since late 2022, more than 50% of the coins trading are doing so below their purchase price, according to Vetle Lunde at K33 Research.
Note: As of 5:00 pm EDT 10 June 2026
Fixed Income
US 10-year yield +11.6 bps MTD and +38.7 bps YTD to 4.559%
German 10-year yield +13.7 bps MTD and +21.9 bps YTD to 3.079%
UK 10-year yield +11.8 bps MTD and +46.1 bps YTD to 4.939%
US Treasury yields moved higher on Wednesday after reversing an early dip that followed a softer-than-expected May core CPI print.
By the close, yields had risen across the curve, with the policy-sensitive 2-year note up +2.3 bps at 4.158%, the 10-year yield +3.7 bps higher at 4.559% and the 30-year yield up +3.5 bps at 5.032%.
The move left the 2s10s curve 1.3bps flatter at 40.1 bps from last week’s 41.4 bps, reflecting a modest bear-flattening bias.
Inflation data sent a mixed signal to rates markets. Headline CPI rose 0.5% in May, lifting the annual rate to 4.2%, the highest since April 2023 and above April’s 3.8% pace. Core CPI, which excludes food and energy, increased 0.2% m/o/m and 2.9% y/o/y, both below expectations and softer than the previous month’s readings. Even so, the moderation in core inflation was not enough to prevent a broader sell-off in Treasuries as the session progressed.
Treasury supply also remained in focus. The US Treasury drew solid demand at its $39 billion 10-year note auction, the second leg of this week’s $119 billion coupon-bearing supply. The issue stopped at a high yield of 4.538%, marginally below the prevailing market level ahead of the sale, while the bid-to-cover ratio of 2.57x was the strongest since September.
Earlier in the week, a $58 billion three-year note sale drew average demand, and the Treasury is scheduled to sell $22 billion in 30-year bonds today.
The US yield curve moved higher across maturities over the course of the week. At the front-end, the 2-year yield was +7.2 bps higher over the past seven days, the 10-year yield advanced by +5.9 bps and, at the longer end, the 30-year yield traded +3.9 bps higher.
According to CME Group's FedWatch Tool, Fed funds futures traders are now pricing in a 1.6% probability of a 25 bps rate cut at June’s FOMC meeting, compared to 2.7% from last week. Fed funds futures traders are pricing in 26.0 bps of rate hikes in 2026, higher than the 18.9 bps of rate hikes priced in a week ago.
Across the Atlantic, in the UK, Britain’s 10-year Gilt yield advanced by +3.1 bps to 4.939%. On a weekly basis, the 10-year Gilt yield is +0.3 bps higher.
Eurozone government bond yields also moved higher, with attention turning to Thursday’s ECB policy decision, where markets widely expect a 25 bps rate increase.
Germany’s 10-year Bund yield rose +3.3 bps to a two-week high of 3.079%, while the 2-year Schatz yield, which is sensitive to the ECB deposit rate expectations, climbed +4.8 bps to 2.726%. At the long end, the 30-year Bund yield advanced +1.8 bps to 3.610%.
With an ECB hike largely priced in, investors are focused on whether the central bank, and President Christine Lagarde in particular, will offer guidance on the likely path of policy beyond this meeting, while the prospect of higher fiscal spending in the future is also drawing close market attention.
Money markets were pricing in around 68 bps of additional ECB tightening this year, implying two further 25 bps hikes and roughly a 70% probability of a third.
Italy’s 10-year BTP yield advanced by +1.6 bps to 3.836%, while the spread over German Bunds stood at 75.7 bps, or 2.2 bps higher than last week’s 73.5 bps. Over the past seven days, the 10-year BTP yield has increased by +6.3 bps.
During the past week, the German yield curve bear-flattened slightly, by 0.2 bps to 35.3 bps from last week’s 35.5 bps. Over the course of the past seven days, the two-year Schatz yield traded +4.3 bps higher, while yield on the 10-year bund rose by +4.1 bps. At the longer end, the 30-year German yield was +3.5 bps higher.
The yield spread between German Bunds and 10-year UK gilts reached 186.0 bps on Wednesday, a decrease of 3.8 bps over the past seven days.
The spread between US 10-year Treasuries and German Bunds is now 148.0 bps, reflecting a slight expansion of 1.8 bps from last week’s 146.2 bps.
Commodities
Gold spot -10.19% MTD and -5.58% YTD to $4,073.46 per ounce
Silver spot -15.35% MTD and -10.60% YTD to $63.71 per ounce
West Texas Intermediate crude +4.66% MTD and +59.99% YTD to $91.85 a barrel
Brent crude +2.99% MTD and +55.54% YTD to $94.74 a barrel
Gold prices fell more than four percent on Wednesday as fears of a broader US-backed conflict with Iran heightened concerns that rising inflation could prompt further interest rate increases. Investors are also looking to upcoming US data for signals on the likely path of monetary policy.
Spot gold declined by -4.14% to $4,073.46 per ounce, its lowest level since 23 March. On a weekly basis, spot gold was -8.09% lower.
Spot silver also fell -2.53% to $63.71 per ounce. It declined -3.20% over the past week.
Oil prices rose more than three percent on Wednesday after the US President warned that the US would strike Iran forcefully if a peace deal is not reached.
Brent crude settled at $94.74 a barrel, up $2.91 or +3.17%, while US WTI closed at $91.85, up $3.15 or +3.55%. Over the past week, WTI has declined -4.52%, while Brent is down -3.20%.
Prices trimmed some gains late in the session after Trump said the US military had secretly escorted ships carrying more than 100 million barrels of oil through the Strait of Hormuz.
Overnight, the US struck nearly 20 Iranian targets, including air defence systems, radar sites and ground-control stations, after the President pledged retaliation for the downing of an Apache helicopter earlier in the week. Iran responded with missile and drone attacks on US military bases in Jordan, Kuwait and Bahrain, according to the IRGC.
Despite the overnight escalation, crude traded lower early in the session and only turned higher shortly before 07:00 ET, after Trump said on Truth Social that Iran had taken too long to negotiate and would now ‘pay the price.’ He later said the US would attack Iran ‘very hard’ and that action could come as soon as today. CNN also reported that Qatari negotiators were in Iran trying to narrow the gap between Washington and Tehran.
Oil flows through the Strait appear to be improving. Bloomberg news reported that Iraq is accelerating loadings at its main export terminal, while other reports pointed to more vessels using alternative routes and an increase in dark ship-to-ship transfers in the region. Together, these developments add to broader signs this week that more oil is moving through the Strait.
Prices were also supported by US Energy Information Administration data showing a sharp decline in crude inventories last week, as refiners moved to address supply disruptions caused by the conflict.
Separately, the US Department of Energy said it is considering loans of up to 40 million barrels of crude from the Strategic Petroleum Reserve to energy companies in an effort to ease fuel prices.
In a move that could further complicate negotiations, the UN nuclear watchdog’s 35-member Board of Governors passed a US-backed resolution requiring Iran to declare its remaining enriched uranium stockpiles and allow inspectors to verify them.
Ukraine also struck another Russian refinery, halting operations at the Kuibyshev plant in Samara.
EIA report. The latest US Energy Information Agency (EIA) report, released on Wednesday, showed that US crude oil refinery inputs averaged 17.0 million barrels per day during the week ending 5 June 2026. This was 80 thousand barrels per day more than the previous week’s average. Refineries operated at 95.3% of their operable capacity last week. Gasoline production increased last week, averaging 9.7 million barrels per day. Distillate fuel production increased, averaging 5.2 million barrels per day.
US crude oil imports averaged 5.9 million barrels per day last week, a decrease of 0.5 million barrels per day from the previous week. Over the past four weeks, crude oil imports averaged about 5.9 million barrels per day, 5.8% less than the same four-week period last year. Total motor gasoline imports last week averaged 714 thousand barrels per day, and distillate fuel imports averaged 130 thousand barrels per day.
US commercial crude oil inventories decreased by 7.2 million barrels from the previous week and were at 426.5 million barrels. US crude oil inventories are about 5% below the five-year average for this time of year. However, total motor gasoline inventories increased by 0.2 million barrels from last week, but are 6% below the five-year average for this time of year. Finished gasoline inventories increased, while blending component inventories decreased last week. Distillate fuel inventories decreased by 0.2 million barrels last week and are about 13% below the five-year average for this time of year. Total commercial petroleum inventories decreased by 5.6 million barrels last week.
Total products supplied over the last four-week period averaged 20.6 million barrels per day, up by 3.5% from the same period last year. Over the past four weeks, motor gasoline product supplied averaged 8.8 million barrels per day, down by 0.5% from the same period last year. Distillate fuel product supplied averaged 3.7 million barrels per day over the past four weeks, up 7.2% from the same period last year. Jet fuel product supplied was down 2.2% compared with the same four-week period last year.
Note: As of 5:00 pm EDT 10 June 2026
Key data to move markets
EUROPE
Thursday: ECB Main Refinancing Operations Rate, Rate on Deposit Facility, Monetary Policy Statement, Press Conference, European Council Meeting and Eurogroup Meeting
Friday: German and Spanish CPI and Harmonised Index of Consumer Prices, French CPI, Ecofin Meeting and speeches by De Nederlandsche Bank President Olaf Sleijpen and Bundesbank President Joachim Nagel
Monday: Eurozone Industrial Production and Trade Balance
Tuesday: Italian CPI, German ZEW Surveys on Current Situation and Economic Sentiment and Eurozone ZEW Survey on Economic Sentiment
Wednesday: Eurozone Harmonised Index of Consumer Prices and Core Harmonised Index of Consumer Prices
UK
Friday: GDP, Industrial Production, Manufacturing Production and Consumer Inflation Expectations
Wednesday: CPI and Core CPI, PPI Input, Output and Core Output and Retail Price Index
USA
Thursday: Initial and Continuing Jobless Claims, PPI and Core PPI
Friday: Michigan Consumer Expectations and Sentiment Indices and UoM 1- and 5-year Consumer Inflation Expectations
Monday: NY Empire State Manufacturing Index and Industrial Production
Tuesday: ADP Employment Change 4-week Average, Building Permits and Housing Starts
Wednesday: Fed Interest Rate Decision, Fed Monetary Policy Statement, FOMC Economic Projections, Interest Rate Projections, FOMC Press Conference, Retail Sales, Retail Sales Control Group, Retail Sales ex-Autos and Pending Home Sales
JAPAN
Monday: BoJ Interest Rate Decision and Monetary Policy Statement
Tuesday: BoJ Press Conference, Adjusted Merchandise Trade Balance, Exports and Imports
CHINA
Tuesday: Industrial Production and Retail Sales
While every effort has been made to verify the accuracy of this information, EXT Ltd. (hereafter known as “EXANTE”) cannot accept any responsibility or liability for reliance by any person on this publication or any of the information, opinions, or conclusions contained in this publication. The findings and views expressed in this publication do not necessarily reflect the views of EXANTE. Any action taken upon the information contained in this publication is strictly at your own risk. EXANTE will not be liable for any loss or damage in connection with this publication.
This article is provided to you for informational purposes only and should not be regarded as an offer or solicitation of an offer to buy or sell any investments or related services that may be referenced here. Trading financial instruments involves significant risk of loss and may not be suitable for all investors. Past performance is not a reliable indicator of future performance.


Created by professionals. For professionals.
