
Are gasoline inventories the signal?

Key data to move markets today
US: CPI and Core CPI
CHINA: CPI and PPI
Global Macro Updates
Running on empty: US gasoline stocks near critical lows this summer. US gasoline inventories have declined steadily since late February and are now tracking below 2025 levels, driven by a surge in exports aimed at offsetting global supply disruptions stemming from the effective closure of the Strait of Hormuz. According to Richard Joswick, head of oil pricing and trade flow analytics at S&P Global Energy CERA, the market is approaching an effective operational floor, not an absolute minimum, but a level at which export capacity becomes physically constrained, as depleted storage tanks prevent exporters from accumulating sufficient volumes to load vessels efficiently. Combined US commercial crude and product inventories have fallen approximately 480 million barrels from late February through 22 May, averaging draws of 5.7 million bpd.
The supply squeeze is most acute on the US Atlantic Coast, where limited local refining capacity, down roughly 400,000 bpd since 2019, and dependence on waterborne supply from the Gulf Coast have amplified tightness. In response, waterborne imports of gasoline and blending components into the Atlantic Coast have risen from 537,000 bpd in May to 664,000 bpd in early June. Analysts forecast Gulf Coast crack spreads to surge from approximately 25 cents/gallon to near 50 cents/gallon, approaching or exceeding record levels. The combination of constrained domestic supply, restricted Asian and European export availability and peak summer driving demand underpins this outlook through August and September.
For US refiners, including names such as Valero Energy, Phillips 66 and Marathon Petroleum, the environment is constructive but nuanced. Surging crack spreads point to materially higher refining margins, supporting near-term earnings upside. However, refiners face margin compression from elevated high-octane blending component costs, as curtailed Asian steam cracker operations have tightened global reformate and aromatics supplies. Naphtha's relative weakness versus gasoline has preserved blending economics for now, offering a partial offset.
For US oil producers, record net export volumes, reaching 5.8 million bpd in April, reflect robust global demand for US crude and refined products. Higher Brent benchmarks and widening domestic price realisations support revenue growth and cash flow generation for upstream operators, particularly those with Gulf Coast or Permian Basin exposure. Nonetheless, the recovery timeline tempers the outlook: even if the Strait of Hormuz reopens by late July, the ~30-day transit time for Middle East crude to reach US refineries means product stock draws are expected to persist through September, delaying the normalisation of inventory levels and sustained price relief.
CERA does not anticipate an outright gasoline shortage; rather, higher prices will serve as the rebalancing mechanism, suppressing demand while incentivising maximum domestic production and reducing exports. Critically, the pre-conflict expectation of a 200-million-barrel stock build through Q2 2026 never materialised, effectively eliminating a buffer that compounds the impact of the 480 million barrels already drawn. Full rebalancing is not expected before late 2026 at the earliest.
NFIB small-business optimism falls to a two-and-a-half-year low. The NFIB small-business optimism index fell to 95.3 in May from 95.9 previously, marking its lowest headline reading since October 2024. Employment conditions were broadly unchanged. Although fewer firms reported positions they were unable to fill, both job openings and hiring plans declined to their lowest levels in six years.
At the same time, the report showed some resilience in business activity. A greater share of firms reported capital outlays over the past six months, sales volumes improved in May and net profit trends strengthened. However, reports of actual and planned price increases rose sharply, and the share of businesses intending to raise prices over the next three months reached its highest level since July 2022.
Taxes were cited as the single most important problem by 19% of small businesses, while inflation rose to 18%, marking its third consecutive increase. The survey also showed that 14% of respondents identified labour costs as their chief concern, the highest share recorded in the survey’s history.
May CPI Preview. The May CPI report is due today at 8:30 ET. Consensus expects core CPI to rise 0.3% m/o/m, easing from April’s 0.38% print, which was the strongest since January 2025. Forecasts across the Street range from 0.30% on the high side, including Jefferies, to 0.17% on the low side, including Goldman Sachs and UBS. On a y/o/y basis, core CPI is expected to edge up to 2.9% from 2.75%, which was the highest reading since September 2025.
Headline CPI is expected to moderate to 0.5% m/o/m from 0.6% in April, while the annual rate is projected to accelerate to 4.2% from 3.8%.
Within goods, previews point to upside pressure from used vehicles, where wholesale prices have risen in recent months. Deutsche Bank has also highlighted apparel and information technology goods as potential sources of upside risk, reflecting the effects of tariffs.
In services, analysts expect upward pressure from shelter to begin reversing as the effects of the October government shutdown fade. Even so, JPMorgan economists see upside risks in education and communications, partly driven by higher delivery-related costs following the USPS price increase and fuel surcharges from UPS and FedEx.
BofA economists said that, beyond airfares, there is still limited evidence that higher energy prices have passed through to core inflation, although they cautioned that such effects could emerge soon, particularly with the Global Supply Chain Pressure Index at its highest level since 2022. They also argued, however, that the current labour market backdrop, fiscal setting and broader demand dynamics differ from earlier inflationary periods and may reduce the risk of a sustained reacceleration in core prices.
US Stock Indices
Dow Jones Industrial Average +0.17%
Nasdaq 100 -1.12%
S&P 500 -0.26%, with 2 of the 11 sectors of the S&P 500 down
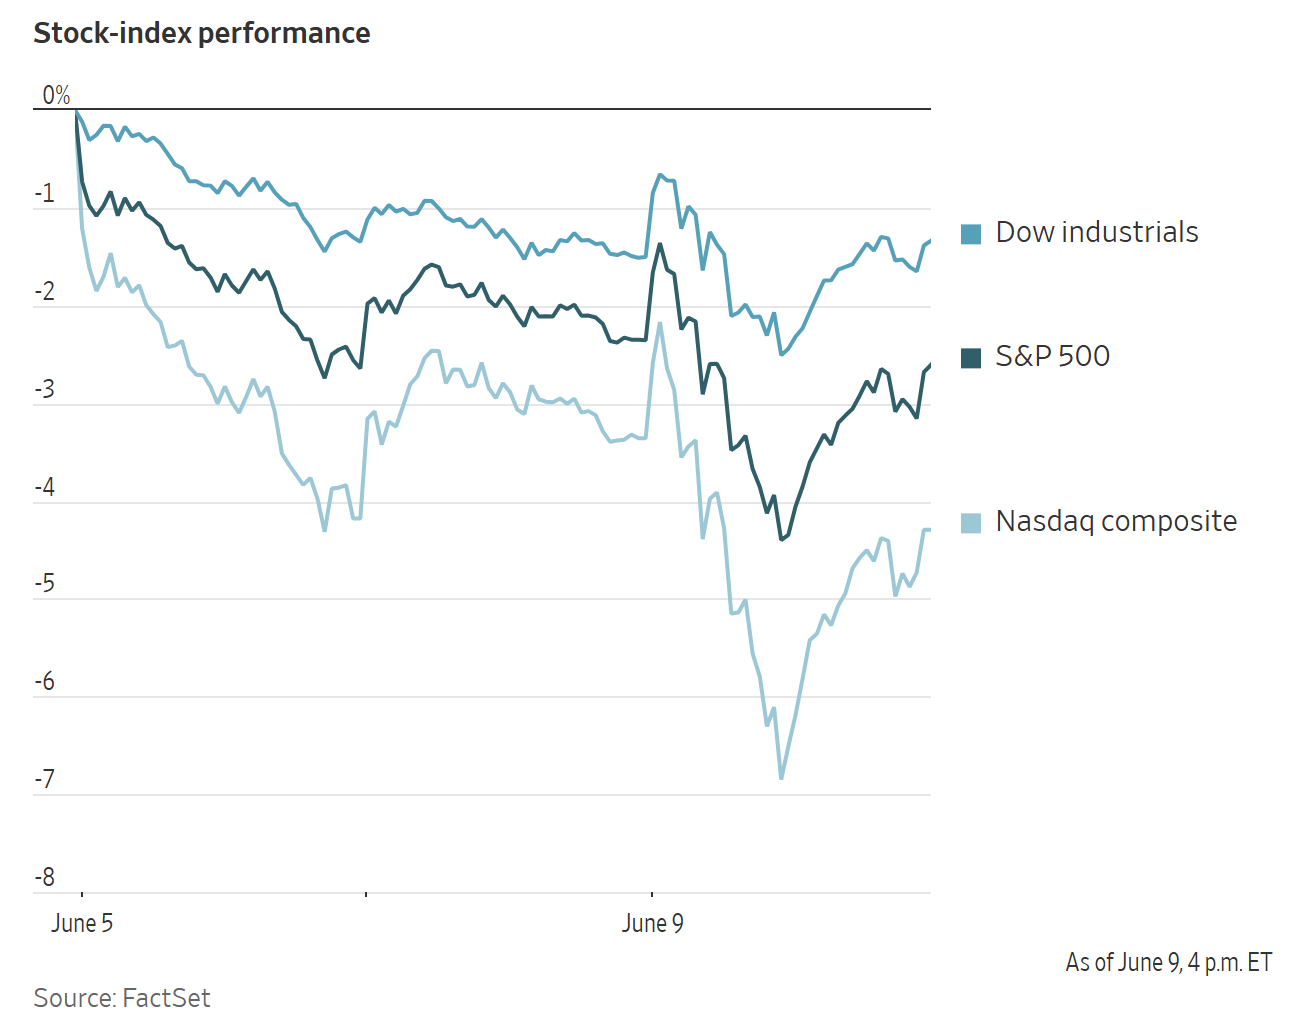
US equities opened higher on Tuesday, sold off around midday, and then recovered part of those losses into the close. Even so, the major indices mostly finished lower. The Nasdaq fell -0.97%, the S&P 500 slipped -0.26% and the Dow Jones Industrial Average rose 86.10 points, or +0.17%, to close at 50,872.11.
Trading activity was exceptionally strong. A total of 23.5 billion shares changed hands across the US market, marking the third-highest daily volume of the year, according to Dow Jones Market Data. Nasdaq composite turnover reached 12.1 billion shares, the second-highest total of 2026.
In corporate news, Anthropic began broad distribution of a version of Mythos that is restricted from performing cybersecurity tasks, months after the company cautioned that the model could identify and exploit vulnerabilities in critical software.
In a deal valued at $10.6 billion, GSK has reached an agreement to purchase Nuvalent. This acquisition provides the pharmaceutical giant with a US-based biotech firm specialising in therapies for lung cancer, aiding GSK's strategic move to strengthen its oncology portfolio. The purchase price of $124 per share in cash represents a 40% premium compared to the stock's closing value on Monday.
S&P 500 Best performing sector
Real Estate +2.13%, with Alexandria Real Estate +5.35%, Kimco Realty +3.92% and Public Storage +3.79%
S&P 500 Worst performing sector
Information Technology -1.82%, with Super Micro Computer -7.62%, Corning -7.25% and ServiceNow -6.32%
Mega Caps
Alphabet +0.31%, Amazon -0.42%, Apple -3.64%, Meta Platforms -0.14%, Microsoft -2.02%, Nvidia -0.22% and Tesla -3.00%
Information Technology
Best performer: Amphenol +7.29%
Worst performer: Super Micro Computer -7.62%
Materials and Mining
Best performer: International Flavors & Fragrances +4.38%
Worst performer: Dow -2.87%
European Stock Indices
CAC 40 +0.05%
DAX -0.74%
FTSE 100 -1.41%
Commodities
Gold spot -1.83% to $4,249.41 an ounce
Silver spot -4.12% to $65.36 an ounce
West Texas Intermediate -2.83% to $88.70 a barrel
Brent crude -2.52% to $91.83 a barrel
Gold declined on Tuesday, falling to its lowest level since 23 March as markets turned their attention to key inflation data due later in the day.
Spot gold fell -1.83% to $4,249.41 per ounce after dropping more than two percent earlier in the session.
Spot silver declined -4.12% to $65.36 per ounce.
Oil prices fell again on Tuesday, reaching a seven-week low after Iran and Israel said they had halted hostilities following an appeal from the US President. However, the announcement later in the session by the US President that Iran had shot down a US helicopter in the Strait of Hormuz and that the US would respond, prompted oil prices to recover modestly.
Brent crude futures fell $2.37, or -2.52%, to settle at $91.83 a barrel, while US WTI crude declined $2.58, or -2.83%, to close at $88.70.
The settlement marked Brent’s lowest close since 17 April and WTI’s lowest since 29 May. It was also the first time since January that Brent finished below its 100-day moving average, a key technical support level.
President Trump had said a deal to end the conflict could be reached within two to three days. On Tuesday morning, Sky News reported that Iran had submitted a draft agreement to the US for review and that the administration viewed the proposal as preliminarily acceptable. Crude prices weakened further after reports that the US embassy in Jerusalem had lifted its shelter-in-place order. Shortly before 13:00 ET, however, crude and refined products rebounded briefly after the President said the US would have to respond to Iran’s attack on an Apache helicopter the previous night, although the pilots were reported safe.
Israeli Prime Minister Benjamin Netanyahu told the security cabinet that Israel may need to confront Iran without US support, acknowledging that such a path would be difficult, but increasingly likely.
In China, May crude imports fell to an eight-year low of 33.08 million metric tons, equivalent to about 7.79 million bpd, down from 9.3 million bpd in April and well below the pre-conflict average of more than 11.0 million bpd. By contrast, China’s fuel exports rose to 3.37 million metric tons in May, compared with 3.1 million metric tons in March.
Reuters also reported that China had issued its second batch of fuel export quotas for the year, totalling 18 million metric tons, with overall volumes broadly steady year on year despite existing export restrictions.
EIA Short-Term Energy Outlook. The near-term closure of the Strait of Hormuz continues to weigh heavily on global oil markets. The EIA assumes the strait will remain effectively closed in the near term, with shipping resuming gradually in the Q3 2026. However, a full return to pre-conflict traffic levels is not expected until early 2027, as ramping up operations will require several months. Some Middle East oil production disruptions are anticipated to persist beyond the STEO forecast horizon.
Market volatility remains acute. The near-halt in Hormuz traffic has forced Middle Eastern producers to cut crude output by more than 11 million barrels per day (bpd) in May relative to pre-conflict levels. To bridge the supply gap and sustain demand, global inventories have been drawn down sharply. The EIA projects average inventory declines of 6.3 million bpd in Q2 and 7.6 million bpd in Q3. OECD oil inventories are forecast to fall to their lowest levels since 2003.
The combination of elevated fuel prices, constrained availability and government-led conservation measures has suppressed global consumption. The EIA now projects global oil demand will decline by 1.1 million bpd in 2026 from 2025's level of 104.0 million bpd, a sharp reversal from the 0.2 million bpd growth projected in May's STEO and the 1.2 million bpd expansion forecasted as recently as February. Demand is expected to recover meaningfully in 2027, growing by 2.5 million bpd to reach 105.3 million bpd as supply flows normalise later in 2026.
Brent crude fell in May despite ongoing supply outages, driven by softening demand and news of potential US-Iran diplomatic progress. Nevertheless, with the strait largely closed, tightening inventories are expected to keep Brent averaging $105 per barrel in June and July. As Hormuz shipping resumes and shut-in production is gradually restored, prices are projected to ease to an average of $79 per barrel in 2027.
Rising global crude benchmarks are lifting US wholesale petroleum prices considerably. Diesel and jet fuel are leading the increase, projected to rise over 60% and 40% in 2026 and 2027, respectively, versus the pre-conflict February baseline. Wholesale gasoline is forecast to increase approximately 50% in 2026 and nearly 40% in 2027. On the export side, global supply disruptions have driven strong demand for US crude and refined products, pushing net exports to a record 5.8 million bpd in April. Net exports are expected to average 4.2 million bpd for full-year 2026, up 1.4 million bpd from 2025.
The Henry Hub spot price edged higher in May on stronger electricity demand tied to warmer weather, yet prices remain broadly stable for 2026 as supply growth, largely driven by associated gas from higher crude production, offsets demand. The EIA forecasts Henry Hub to average $3.34/MMBtu in H2 2026 and $3.55/MMBtu in H2 2027, with rising LNG exports and power sector demand providing upward pressure in late 2027. Above-average summer temperatures are expected to lift US electricity generation by 3% versus summer 2025, led by a 19% surge in solar output and 10% growth in wind, while coal generation declines 2% and natural gas output holds roughly steady.
Note: As of 4 pm EDT 9 June 2026
Currencies
EUR +0.02% to $1.1537
GBP +0.22% to $1.3368
Bitcoin -3.16% to $61,721.31
Ethereum -3.22% to $1,648.88
The dollar traded modestly lower against its major peers on Tuesday.
The euro rose +0.02% against the dollar to $1.1537, after touching a two-month low in the previous session.
The US dollar index slipped -0.03% to 99.99, following Monday’s move to 100.21, its highest level since 6 April.
Attention is shifting to the ECB’s policy meeting tomorrow, where markets widely expect a 25 bps rate increase. Thursday’s decision will be closely watched for guidance on the policy path ahead.
At the same time, a BoJ rate hike at the 16 June policy meeting is now almost fully priced in, suggesting that, if delivered, it is unlikely by itself to trigger a meaningful rebound in the yen.
The yen weakened -0.12%, trading at a session low of ¥160.34.
Fixed Income
US 10-year Bond -4.6 basis points to 4.552%
German 10-year Bund -1.8 basis points to 3.046%
UK 10-year Gilt -4.0 basis points to 4.908%
US Treasury yields moved lower on Tuesday as investors await key consumer price inflation data due today following Friday’s stronger-than-expected May employment report, which reinforced expectations of a “higher or longer” rate policy environment.
The 2-year Treasury yield, particularly sensitive to expectations for the Fed funds rate, declined -3.1 bps to 4.135%.
The 10-year Treasury yield fell -4.6 bps to 4.522%, while the 30-year yield declined -4.2 bps to 4.997%.
As a result, the 2s10s curve bull-flattened to 38.7 bps.
Market participants were also focused on demand for longer-dated US government debt ahead of the Treasury’s $119 billion in coupon-bearing auctions scheduled for the week.
On Tuesday, the Treasury recorded moderate demand at its $58 billion 3-year note auction. The issue priced at a high yield of 4.192%, marginally above the pre-auction level, while the bid-to-cover ratio of 2.64x was the strongest since April.
The Treasury is due to auction $39 billion in 10-year notes today and $22 billion in 30-year bonds on Thursday.
According to CME Group's FedWatch Tool, Fed funds futures traders are pricing 26.2 bps of rate hikes in 2026, higher than the 17.1 bps priced in a week ago. Fed funds futures traders are now pricing in a 1.8% probability of a 25 bps rate cut at June’s FOMC meeting, compared to a 2.4% probability of a rate cut last week.
In Europe, government bond yields were also modestly lower on Tuesday.
Germany’s 10-year Bund yield fell -1.8 bps to 3.046%.
The ECB is widely expected to raise its deposit rate by 25 bps to 2.25% on Thursday, marking its first policy move in a year, although markets remain primarily focused on the guidance that may follow.
Price pressures across the euro area have begun to firm since the start of the Iran conflict, although a survey released earlier this month showed that consumers’ inflation expectations remained stable in April.
Money markets are now pricing in approximately 66 bps of tightening by year-end, implying one additional 25 bps increase and a meaningful probability of a third move.
Germany’s 2-year Bund yield, which is more sensitive to shifts in ECB rate expectations, declined -4.1 bps to 2.678% after reaching an almost three-week high of 2.734% on Monday. At the long end, the 30-year Bund yield eased -0.5 bps to 3.592%.
Italy’s 10-year BTP yield fell -1.1 bps to 3.820%, leaving the spread over Bunds at 77.4 bps.
Note: As of 4 pm EDT 9 June 2026
While every effort has been made to verify the accuracy of this information, EXT Ltd. (hereafter known as “EXANTE”) cannot accept any responsibility or liability for reliance by any person on this publication or any of the information, opinions, or conclusions contained in this publication. The findings and views expressed in this publication do not necessarily reflect the views of EXANTE. Any action taken upon the information contained in this publication is strictly at your own risk. EXANTE will not be liable for any loss or damage in connection with this publication.
This article is provided to you for informational purposes only and should not be regarded as an offer or solicitation of an offer to buy or sell any investments or related services that may be referenced here. Trading financial instruments involves significant risk of loss and may not be suitable for all investors. Past performance is not a reliable indicator of future performance.


Created by professionals. For professionals.
