
What does the next catalyst look like?

Key data to move markets today
EU: German Retail Sales, German, Eurozone, Spanish, French and Italian HCOB Manufacturing PMIs and Eurozone Unemployment Rate
US: ISM Manufacturing PMI, Prices Paid, New Orders and Employment Indices
Global Macro Updates
Can the rally hold when every catalyst cuts both ways? The week ended 29 May offered a vivid study in the tensions that have come to define this market cycle, one where the same catalysts that animate conviction on one side of the ledger simultaneously feed skepticism on the other.
The geopolitical dimension was central. Reports that US and Iranian negotiators had reached a tentative 60-day MOU, one that would extend the ceasefire, initiate nuclear talks and restore unrestricted transit through the Strait of Hormuz, drove a sharp pullback in oil prices and yields, providing relief to risk sentiment. That reprieve landed at a sensitive moment: a breakout earlier in the month had already prompted concern about structural pressure on longer-duration rates, making the Iran-driven compression consequential for equity multiples. Energy sector positioning shifted rapidly, as Strait of Hormuz reopening plays outperformed across the week. And yet, by Friday, the same diplomatic story carried a different tone. The US President had not signed off on the framework, mixed messaging persisted throughout the weekend and military flare-ups undercut confidence in the trajectory of talks. For investors, the episode underscored a challenge that has shaped the geopolitical risk trade in recent weeks: the disconnect between headline-driven sentiment and the slow, complex reality of reaching an agreement.
The AI infrastructure theme remained the equity market's dominant narrative, though the week added important layers of nuance. Dell's Q1 print was exceptional by any measure, AI server revenue surged 757% y/o/y to $16.1 billion, total AI orders reached $24.4 billion and the company raised its full-year AI revenue forecast to $60 billion from $50 billion. Snowflake's more than thirty six percent single-session surge following better-than-expected product revenue growth and a $6 billion deal with AWS for Graviton chip infrastructure reinforced the narrative that enterprise adoption of AI tooling is accelerating, not plateauing. However, the week also brought a significant countercurrent: the emerging ‘tokenmaxxing’ backlash. Corporate leaders, most prominently Uber's COO, publicly questioned whether surging AI spending is generating proportional productivity returns, with some companies reportedly exhausting their annual AI budgets in a matter of months. If enterprise allocation discipline tightens, the demand signal underpinning the AI capex supercycle becomes harder to extrapolate with confidence.
The macro backdrop presented its own version of the same duality. Consumer resilience held up in corporate commentary at the Bernstein conference, where airline executives cited robust travel demand and bank and credit card executives highlighted continued economic strength. Against that, the April PCE report showed the personal savings rate falling to its lowest level in roughly two decades at 2.6%, and credit card delinquencies have climbed to their highest level since 2011.
Monetary policy added its own layer of complexity. Fedspeak, including St. Louis Fed President Alberto Musalem and Chicago Fed President Austan Goolsbee, pushed back emphatically against the notion that AI productivity gains provide cover for easing, with Goolsbee warning explicitly that the bigger the AI productivity hype, the more rates may need to rise to prevent overheating. Core PCE inflation remains above 3%, well clear of the Fed's 2% target. In the weeks ahead, investors will need to navigate a layered set of catalysts: progress (or absence of) on the Iran deal and USMCA auto content renegotiations; incoming inflation data and any shift in Fedspeak. The path forward, as the week amply illustrated, runs through the resolution, or further deferral, of each of these open questions.
US Stock Indices
Dow Jones Industrial Average +0.72%
Nasdaq 100 +0.36%
S&P 500 +0.22%, with 2 of the 11 sectors of the S&P 500 up
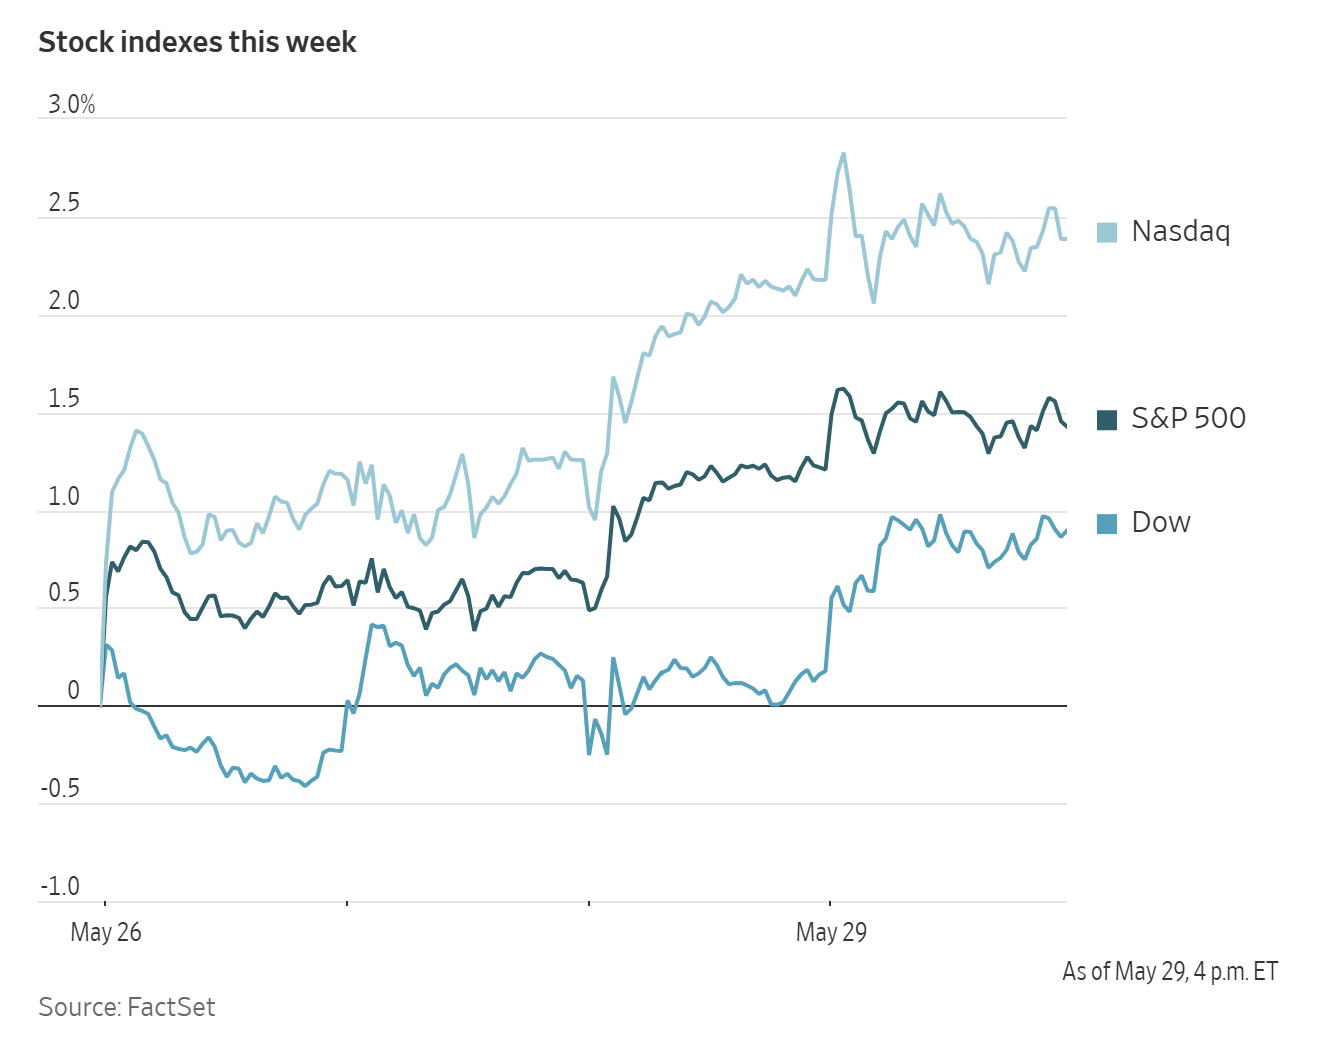
On Friday, all three major US equity indices reached new highs. The Nasdaq Composite was +0.20%, or 55.15 points to 26,972.62. The S&P 500 was +0.22%, or 16.43 points to 7,580.06. Both indices reached new records, while the S&P 500 notched a six-day winning streak. The Dow Jones was +0.72%, or 363.49 points higher, to 51,032.46, crossing 51,000 for the first time.
Defying the traditional ‘sell in May and go away’ saying, US equities closed the month with another strong advance. The Nasdaq Composite posted its biggest two-month gain since November 2002, rising +24.93% over that span, while the S&P 500 recorded its strongest two-month performance since May 2020 at +16.11% and ended the week with a ninth consecutive gain.
According to LSEG I/B/E/S data, y/o/y earnings growth for the S&P 500 in Q1 2026 is projected to be +29.3%. This jumps to +30.7% when excluding the Energy sector.
Of the 482 companies in the S&P 500 that have reported earnings to date for Q1, 84.0% have reported earnings above analyst estimates, with 79.7% of companies reporting revenues exceeding analyst expectations. The y/o/y revenue growth is projected to be 11.3% in Q1, increasing to 11.9% when excluding the Energy sector.
Information Technology at 98.5%, is the sector with most companies reporting above estimates. Additionally, Energy with a surprise factor of 19.0%, is the sector that has beaten earnings expectations by the highest surprise factor. Within Communication Services, 35.0% of companies have reported below estimates. It is also the sector with the smallest surprise factor, exceeding estimates by 2.7%. The S&P 500 surprise factor is now 8.2%. The forward four-quarter price-to-earnings ratio (P/E) for the S&P 500 sits at 21.6x.
12 S&P 500 companies are scheduled to release their Q1 earnings reports this week.
In corporate news, Universal Music Group rejected an unsolicited bid from Bill Ackman’s Pershing Square, stating that the proposal was not in the best interests of its shareholders or artists.
SpaceX secured a contract worth more than $4 billion to build satellites designed to track foreign aircraft and missiles as part of the US President’s Golden Dome defense shield.
According to Bloomberg news, citing people familiar with the matter, OpenAI has held discussions with banks including Citigroup and JPMorgan Chase for roles in its planned IPO.
Gap shares fell more than fifteen percent after the retailer lowered its full-year revenue outlook and reported weaker sales at Old Navy.
American Eagle Outfitters said performance at its core brand remained below management’s expectations after the segment posted a sales decline in Q1.
Replimune Group said on Friday that it had reached an agreement with the Food and Drug Administration on a pathway to resubmit its application for an experimental treatment for advanced melanoma.
Autodesk agreed to acquire MaintainX for $3.6 billion, raising investor concerns that it may have paid too much to expand in the competitive software sector.
S&P 500 Best performing sector
Information Technology +1.87%, with Dell Technologies +32.76%, NetApp +22.39% and ServiceNow +14.38%
S&P 500 Worst performing sector
Communication Services -1.70%, with Fox -3.11%, Alphabet -2.51% and Charter Communications -2.18%
Mega Caps
Alphabet -2.51%, Amazon -1.23%, Apple -0.14%, Meta Platforms -0.44%, Microsoft +5.45%, Nvidia -1.45% and Tesla -1.45%
Information Technology
Best performer: Dell Technologies +32.76%
Worst performer: Intel -5.14%
Materials and Mining
Best performer: Vulcan Materials +2.23%
Worst performer: CF Industries -3.56%
European Stock Indices
CAC 40 -0.07%
DAX +0.05%
FTSE 100 -0.16%
Commodities
Gold spot +0.91% to $4,535.82 an ounce
Silver spot -0.50% to $75.26 an ounce
West Texas Intermediate -0.87% to $87.76 a barrel
Brent crude -1.74% to $91.99 a barrel
Gold prices advanced on Friday, recovering from the previous session’s two-month low as softer dollar conditions lent support to precious metals.
Spot gold rose +0.91% to $4,535.82 per ounce. Although prices fell to a two-month low of $4,365.76 on Thursday, the metal recovered to close higher. On a broader basis, gold gained +0.60% over the week but declined -1.86% during May.
The dollar index declined -0.38% over the week, making dollar-denominated metals relatively less expensive for overseas buyers and providing additional support to gold prices.
Physical demand, however, remained mixed across key Asian markets. In India, higher prices and import duties continued to restrain buying interest, while in China, premiums narrowed amid cautious sentiment among market participants.
In contrast, spot silver declined -0.50% to $75.26 per ounce. The metal posted a weekly loss of -0.31%, although it still recorded a monthly gain of +2.06% in May.
Oil futures declined on Friday, capping their sharpest weekly fall since early April, as traders awaited confirmation that the US, Israel and Iran had reached a ceasefire agreement.
July Brent crude futures, which expired on Friday, settled at $91.99 per barrel, down $1.63, or -1.74%. US WTI crude closed at $87.76 per barrel, down 77 cents, or -0.87%.
The three-month conflict involving the US and Iran has been accompanied by repeated speculation about an imminent resolution that could reopen the strategically vital Strait of Hormuz. Although both sides indicated that an agreement was nearing completion, their descriptions of its terms continued to diverge.
According to Iran’s Fars news agency, the proposed agreement—still pending formal approval—would require Iran to reopen the strait without restrictions. However, the Islamic Republic stated that it would resume transit under its own predetermined arrangements. Iran has also indicated that, following the conflict, it intends to regulate passage through the strait and impose transit fees.
For the week, Brent fell -11.57%, marking its steepest weekly decline in seven weeks, while WTI lost -9.54%, its largest weekly drop in six weeks. Both benchmarks fell to their lowest levels since mid-April. Over the month of May, WTI declined -16.54% and Brent fell -19.37%.
Reports indicate that the two sides are aligned on most issues, although several key differences remain unresolved. If a memorandum of understanding is finalised, the Strait of Hormuz could re-open and the US blockade could be lifted while further negotiations continue on matters including Iran’s nuclear material and long-term control of the strait.
At the same time, analysts and industry participants have pointed to continued draws in global crude and refined-product inventories, raising the possibility that Brent could move rapidly toward $150 per barrel. The US Department of Energy reported declines in crude, gasoline, distillate and Cushing, Oklahoma stockpiles. In addition, Ukrainian attacks on Russian energy infrastructure continued last week, reportedly forcing at least two refineries offline.
Note: As of 4 pm EDT 29 May 2026
Currencies
EUR +0.09% to $1.1658
GBP +0.09% to $1.3454
Bitcoin -0.57% to $73,332.78
Ethereum -0.58% to $2,007.20
The dollar weakened against major currencies on Friday, extending its decline and posting a second consecutive weekly loss.
The euro rose +0.09% to $1.1658 and advanced +0.48% against the dollar over the week. Sterling also gained +0.09%, trading at $1.3454, and recorded a second straight weekly increase after rising +0.20% in the previous week.
The dollar index declined -0.05% to 98.94, bringing its weekly loss to -0.38%.
The Japanese yen weakened -0.03% to ¥159.26 per dollar, remaining close to the ¥160 threshold that has triggered intervention by Japanese authorities. Over the week, the yen declined -0.04%.
Japan’s Ministry of Finance confirmed on Friday that the government had spent ¥11.7 trillion, approximately $73.5 billion, intervening in currency markets over the past month to support the yen, validating widespread market expectations.
On a monthly basis, the US dollar strengthened against all major currencies in May. The euro fell -0.62%, sterling declined -1.10%, and the Japanese yen weakened -1.73%, while the US dollar index advanced +0.86%.
Fixed Income
US 10-year Bond -0.5 basis points to 4.443%
German 10-year Bund -2.4 basis points to 2.942%
UK 10-year gilt +0.7 basis points to 4.821%
US Treasury yields edged lower for a fourth consecutive session on Friday, concluding a week in which reported progress toward a truce between Washington and Tehran supported a modest improvement in market sentiment.
The yield on the US 10-year Treasury note declined -0.5 bps to 4.443%, bringing its weekly decrease to -12.0 bps, the largest weekly decline since early February. Despite this drop, the yield rose +6.8 bps over May, marking a third consecutive monthly increase.
The yield on the 30-year Treasury bond fell -0.4 bps to 4.970%, resulting in a weekly decline of -9.8 bps, the steepest weekly fall since late February. On a monthly basis, it was marginally higher by +0.2 bps, extending its run of monthly gains to three.
The US Treasury yield curve, measured by the spread between two-year and 10-year Treasury yields, stood at 43.3 bps, 0.2 bps wider than the previous week. Over the course of May, however, the curve narrowed by 6.9 bps from 50.2 bps at the end of April.
The two-year US Treasury yield, which is closely tied to expectations for the Fed funds rate, declined -2.1 bps to 4.010%. This brought its weekly fall to -12.2 bps. Even so, the two-year yield increased +13.7 bps during May, recording its third straight monthly rise.
According to CME Group's FedWatch Tool, Fed funds futures traders are pricing 14.7 bps of rate hikes in 2026, lower than the 24.6 bps priced in a week ago. Fed funds futures traders are now pricing in a 0.4% probability of a 25 bps rate cut at June’s FOMC meeting, compared to a 4.0% probability of a rate hike last week.
Germany’s 10-year Bund yield fell to its lowest level in seven weeks on Friday, as a late rally in euro area government bonds pushed yields lower across the region.
The move gathered pace in late European trading, when broad-based demand for sovereign debt supported a decline in benchmark yields across the euro zone.
Germany’s 10-year Bund yield fell as low as 2.926% before ending Friday’s session at 2.942%, down -2.4 bps on the day and marking its lowest close since 8 April. Over the week, the yield declined -10.1 bps, while during May it fell -9.9 bps.
The two-year German bond yield, which is sensitive to expectations for the ECB deposit rate, declined -0.8 bps on Friday to 2.553%. This brought its weekly fall to -9.4 bps and its monthly decline in May to -9.7 bps.
At the long end of the curve, the 30-year Bund yield fell -2.3 bps on Friday to 3.495%. It declined -7.7 bps over the week and -5.1 bps over the course of May.
Rate expectations continued to shift in response to headlines from the Gulf and the associated moves in oil prices, as investors assessed the risk that higher energy costs could translate into broader inflationary pressures.
While expectations for an ECB rate hike next month solidified last week, market pricing turned more cautious with respect to additional tightening later in the year. Investors continued to price in a second increase by October, while assigning only a limited probability to a third move by year-end.
On the periphery, Italy’s 10-year yield declined -4.2 bps on Friday to 3.653%, contributing to a weekly fall of -11.1 bps. Over May, the 10-year BTP yield fell -20.3 bps, narrowing the spread over Bunds by 10.4 bps to 71.1 bps.
France’s 10-year OAT yield fell -2.6 bps on Friday to 3.552%, bringing its weekly decline to -10.4 bps. Over May, the 10-year OAT yield fell -13.8 bps.
Note: As of 4 pm EDT 29 May 2026
While every effort has been made to verify the accuracy of this information, EXT Ltd. (hereafter known as “EXANTE”) cannot accept any responsibility or liability for reliance by any person on this publication or any of the information, opinions, or conclusions contained in this publication. The findings and views expressed in this publication do not necessarily reflect the views of EXANTE. Any action taken upon the information contained in this publication is strictly at your own risk. EXANTE will not be liable for any loss or damage in connection with this publication.
This article is provided to you for informational purposes only and should not be regarded as an offer or solicitation of an offer to buy or sell any investments or related services that may be referenced here. Trading financial instruments involves significant risk of loss and may not be suitable for all investors. Past performance is not a reliable indicator of future performance.


Created by professionals. For professionals.
