
Will markets correct for faster inflation?

Global Macro Updates
Nvidia’s cashback bonanza. Nvidia delivered another clean beat-and-raise after Wednesday’s close, one that exceeded consensus expectations across virtually every driver, reinforcing the company's position as the primary beneficiary of the accelerating AI CapEx hyper cycle.
Revenue reached $81.615 billion, up 85.2% y/o/y and 19.8% sequentially, versus the Street’s consensus estimate of $79.047 billion. EPS came in at $1.87, ahead of the $1.75 median estimate, and rose 130.4% y/o/y from $0.76 in the year-ago period. Operating income increased 124.7% y/o/y to $52.291 billion. Operating margin expanded by 11.2 percentage points to 64.1%; however, this remained below the Street’s 65.5% consensus. Free cash flow for the quarter totalled $40.115 billion, up from $26.187 billion in the year-ago period, highlighting the company’s ability to convert infrastructure demand into substantial distributable earnings.
The Data Centre segment is the fundamental, structural growth driver. The Data Centre segment generated $75.200 billion in revenue, up 92.3% y/o/y and above the $73.397 billion consensus estimate. This figure explicitly excludes any Data Centre compute revenue from China. Representing 92.1% of total revenue, the segment now defines the company’s financial profile. Demand remains supported by historically elevated hyperscaler capital deployment. CFO Colette Kress noted that hyperscalers accounted for only 50% of Data Centre revenue during the quarter, with the remainder derived from sovereign AI, AI-native cloud, enterprise and industrial customers. This broader customer mix lends further credibility to Jensen Huang’s remarks at GPU Technology Conference in March regarding a $1 trillion Blackwell-plus-Rubin revenue opportunity across calendar 2026 – 2027.
Q2 revenue guidance of approximately $91 billion ±2% exceeded the $87.165 billion analyst estimate — a forward beat that signals sustained demand momentum through the current Blackwell architecture cycle and into the Vera Rubin transition. Nvidia's supply commitment backlog stands at $95.200 billion, affording substantial visibility into the company's shipment profile over the coming 18 months.
On the earnings call, CEO Jensen Huang confirmed that Vera Rubin samples are in active delivery and expressed confidence that the platform would prove ‘even more successful than Grace Blackwell.’ Vera Rubin is engineered to reduce inference token costs by approximately 10x relative to current Blackwell systems, a performance advance that is expected to lower the barrier to enterprise AI adoption and sustain procurement demand well into 2028. Huang characterised the broader infrastructure cycle as ‘the largest expansion in human history, accelerating at extraordinary speed.’
Management authorised an $80 billion share repurchase programme and raised the quarterly dividend by a factor of 25x, from $0.01 to $0.25, actions that reflect institutional confidence in the durability of the company's free cash flow generation and the structural depth of demand underpinning it.
The share price retreated modestly in after-hours trading to $222.12 from a $223.47 closing level, a dynamic that had been anticipated, as market participants had largely priced in a strong print and that forward guidance represented the only meaningful source of incremental upside catalyst. With Q2 guidance clearing estimates, the quarter delivers confirmation rather than surprise: AI infrastructure spending is structurally wider and more durable than consensus assumed entering 2026, Nvidia retains dominant share across it and the Vera Rubin architecture provides the next discrete demand catalyst. The outstanding question for subsequent reporting periods is whether enterprise and sovereign deployments can broaden the demand base beyond hyperscalers, and whether the effective exclusion of China from Nvidia's addressable market, which management has characterised as a $50 billion annual opportunity, becomes a more material constraint on the forward growth trajectory.
Is the Fed getting nervous? At last month’s FOMC meeting, the Fed kept the federal funds rate unchanged at between 3.5% and 3.75%. However, the decision drew the biggest dissension within the FOMC in more than 30 years, with the rate-setting committee split 8-4. The minutes, released on Wednesday, showed that while several policymakers said they felt rate cuts would eventually be warranted, a majority of Fed policymakers felt "some policy firming would likely become appropriate" if inflation stays persistently above the central bank's 2% target. The minutes made clear that a majority of officials think hikes may be necessary if the Iran war continues and inflation continues to rise. A concern around the impact of tariffs complicating the inflation outlook further was also voiced. The minutes showed that many participants indicated that they would have preferred removing the language from the postmeeting statement that suggested an easing bias regarding the likely direction of the Committee's future interest rate decisions.
Governors Beth Hammack, Neel Kashkari and Lorie Logan dissented not to advocate for tightening per se, but to object to the statement's implicit forward guidance, what Hammack characterised as a ‘clear easing bias’ that she deemed ‘inappropriate given the current outlook.’ Kashkari was more direct, arguing that the language suggesting the next move would be a cut was ‘no longer relevant due to the ongoing conflict in Iran.’ The committee's internal debate has migrated from the pace of cuts to the direction of the next move altogether.
The bond market had already drawn its own conclusions before the minutes were published. The 30-year Treasury yield touched 5.197% on Tuesday, its highest level since July 2007, while the 10-year climbed to 4.687%, its highest since January 2025. The move reflects a confluence of forces: elevated energy-driven inflation expectations stemming from the Iran conflict, a fiscal term premium that has expanded to 138 bps on the 10-year and a market increasingly sceptical that the Fed can credibly ease in this environment.
The inflation impulse is neither subtle nor transitory. Consumer prices rose 3.8% y/o/y in April, the largest annual increase since May 2023, with gasoline up 28.4% on the year. Core PCE is tracking near 3.2%, 120 bps above the Fed's target. The Dallas Fed's scenario analysis indicates these pressures could persist well into 2027 depending on the trajectory of the conflict.
The practical consequence is a steeper, term-premium yield curve that simultaneously tightens financial conditions, raises government borrowing costs on new issuance and narrows the policy optionality available to incoming Fed Chair Kevin Warsh, whose first formal FOMC meeting is on 16-17 June. The minutes released yesterday set the tone for those six weeks: a committee that has not yet reached consensus on direction, operating in an inflationary environment that is increasingly energy-driven, structurally persistent and geopolitically complex.
Corporate Earnings Calendar
Thursday: Deckers Outdoor, Deere & Co, Ralph Lauren, Take-Two Interactive Software, Walmart, Williams-Sonoma, Workday
Tuesday: AutoZone
Wednesday: Agilent Technologies, HP, Salesforce, Synopsys
Global market indices
US Stock Indices Price Performance
Nasdaq 100 +6.72% MTD and +16.03% YTD
Dow Jones Industrial Average -0.58% MTD and +2.71% YTD
NYSE -0.53% MTD and +4.63% YTD
S&P 500 +3.11% MTD and +8.58% YTD
The S&P 500 is -0.15% over the past seven days, with 7 of the 11 sectors down MTD. The Equally Weighted version of the S&P 500 is +0.42% over this past week and +6.25% YTD.
The S&P 500 Information Technology is the leading sector so far this month, +9.98% MTD and +17.21% YTD, while Utilities is the weakest sector at -5.24% MTD and +3.97% YTD.
Over the past seven days, Energy outperformed within the S&P 500 at +3.31%, followed by Financials and Consumer Staples at +1.25% and +0.93%, respectively. Conversely, Materials underperformed at -4.53%, followed by Communication Services and Industrials at -2.37% and -1.72%, respectively.
The equal-weight version of the S&P 500 was +1.14% on Wednesday, outperforming its cap-weighted counterpart by 0.06 percentage points.
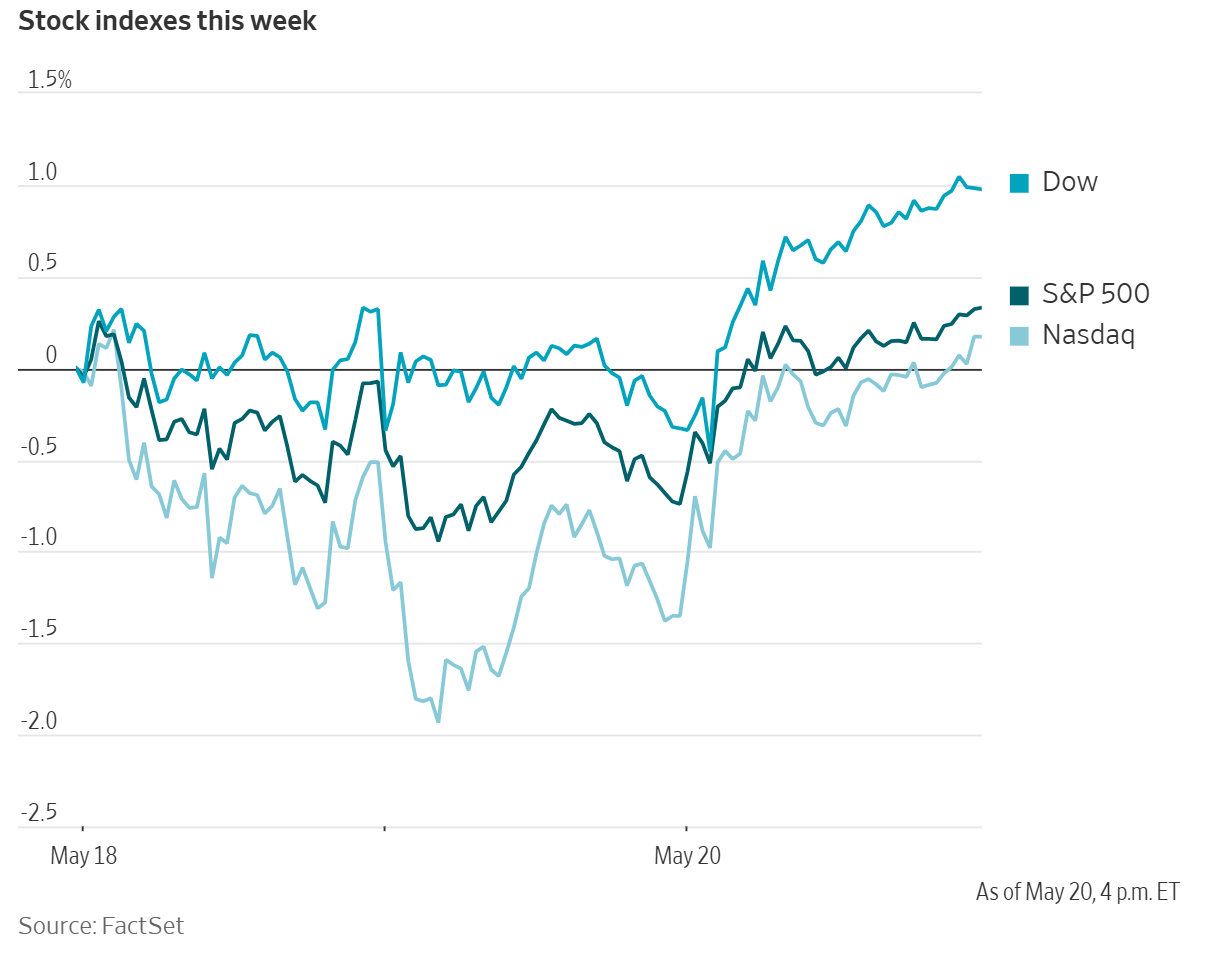
On Wednesday, the Dow Jones Industrial Average was +1.31%, or up 645.47 points, to close at 50,009.35. The S&P 500 was +1.08%, or up 79.36 points, to 7,432.97. The Nasdaq Composite was +1.54%, or up 399.65 points, to 26,270.36. Over the past seven days, the S&P 500 was -0.15%, the Dow Jones Industrial Average was -0.66% and the Nasdaq Composite -0.50%.
In corporate news, SpaceX submitted its S-1 registration statement to the Securities and Exchange Commission on Wednesday, formally initiating what is broadly expected to become the largest initial public offering in capital markets history.
SpaceX is targeting a Nasdaq listing under the ticker SPCX in the second week of June, with a roadshow commencing 4 June and pricing anticipated on 11 June. The company is seeking to raise as much as $75 to $80 billion at a target valuation of approximately $1.75 trillion, a figure that would more than double the $29.4 billion raised by Saudi Aramco in 2019, the current record. Goldman Sachs, Morgan Stanley, JPMorgan, Bank of America and Citigroup lead a syndicate of more than 20 underwriters. Notably, up to 30% of shares are expected to be allocated to retail investors, roughly 3x the conventional norm for a large-cap offering.
The S-1 discloses $18.7 billion in revenue for 2025, the first detailed public look at SpaceX's financial profile. Starlink, the satellite internet division, contributed $11.4 billion, nearly 50% growth y/o/y, alongside $4.4 billion in segment operating income. The consolidated picture is less clean: Starship development consumed approximately $3 billion in R&D expenditure, resulting in an operating loss for the year. Starlink had approximately 10 million subscribers across 164 countries as of early 2026.
The $1.75 trillion valuation, implying a revenue multiple of roughly 93.6x on 2025 figures, is anchored less on current earnings than on convergence across three long-duration growth vectors: Starlink's connectivity platform, Starship as a reusable heavy-lift infrastructure and xAI, acquired by SpaceX in February 2026 in an all-stock transaction valuing the combined entity at $1.25 trillion.
The S-1 claims a total addressable market of $28.5 trillion, of which $26.5 trillion is attributed to AI, a figure that will attract scrutiny, but is consistent with management's framing of SpaceX as an AI infrastructure company as much as an aerospace one. Elon Musk retains effective control through a dual-class structure in which his Class B shares carry 10 votes each, a governance arrangement that investors in other founder-controlled listings are familiar with.
Mega caps: The Magnificent Seven had a largely negative performance over the past week. Over the last seven days, Microsoft +3.91% and Apple +1.13%, while Nvidia -1.05%, Meta Platforms -1.88%, Amazon -1.90%, Alphabet -3.41% and Tesla -6.29%.
Energy stocks had a positive performance this week. The Energy sector itself was +3.31%. WTI and Brent prices are -1.70% and -0.36%, respectively, over the past week. Over the last seven days, APA +6.36%, Occidental Petroleum +4.79%, Phillips 66 +4.38%, ConocoPhillips +4.22%, Marathon Petroleum +3.73%, BP +3.60%, Shell +3.39%, Halliburton +3.12%, ExxonMobil +3.11%, Chevron +2.87% and Baker Hughes +2.11%, while Energy Fuels -16.92%.
Materials and Mining stocks had a negative performance this week, with the Materials sector itself -4.53%. Over the past seven days, Yara International +0.46%, while CF Industries -1.75%, Nucor -2.87%, Mosaic -4.04%, Freeport-McMoRan -9.37%, Newmont Corporation -9.73%, Celanese Corporation -10.79%, Sibanye Stillwater -13.35% and Albemarle -15.29%.
European Stock Indices Price Performance
Stoxx 600 +1.47% MTD and +4.75% YTD
DAX +1.83% MTD and +1.01% YTD
CAC 40 +0.03% MTD and -0.39% YTD
IBEX 35 +1.52% MTD and +4.30% YTD
FTSE MIB +0.23% MTD and +7.59% YTD
FTSE 100 -0.42% MTD and +5.04% YTD
This week, the pan-European Stoxx Europe 600 index is +1.45%. It was +1.46% on Wednesday, closing at 620.29.
So far this month in the STOXX Europe 600, Technology is the leading sector +7.16% MTD and +15.07% YTD, while Utilities is the weakest at -4.09% MTD and +11.66% YTD.
Over the past seven days, Technology outperformed within the STOXX Europe 600, at +4.24%, followed by Food & Beverages and Retail at +3.48% and +3.27%, respectively. Conversely, Basic Resources underperformed at -5.62%, followed by Construction & Materials and Autos & Parts at -2.10% and -1.54%, respectively.
Germany's DAX index was +1.38% on Wednesday, closing at 24,737.24. It was +2.49% over the past seven days. France's CAC 40 index was +1.70% Wednesday, closing at 8,117.42. It is +1.37% over the past week.
The UK's FTSE 100 index was -0.41% over the past week to 10,432.34. It was +0.99% on Wednesday.
In Wednesday's trading session, Technology outperformed, with European semiconductor stocks advancing ahead of Nvidia’s earnings report, scheduled for release after the US market close. Within the technology space, chipmakers are outperforming software names, highlighting a rotation toward hardware and AI exposure.
Basic Resources also advanced as metal prices, particularly copper, moved higher on expectations of easing tensions in the Middle East and following Chile’s decision to lower its production outlook. Oil & Gas is also traded higher, with crude benchmarks remaining above $100 despite some retracement as the perception of geopolitical risk premia moderates. In addition, Norwegian production data and upstream updates continued to be supportive, with Ithaca Energy and Aker BP shares remaining broadly steady.
Industrial Goods & Services traded higher following updates across the aerospace, defence, and support services segments. Defence group CSG shares surged on the back of robust Q1 results, recovering from short-selling concerns. Babcock also rallied after Peel Hunt upgraded the stock in response to a positive EPS surprise and share buyback announcement. Vow advanced on improved profitability, reinforcing positive momentum across cyclical industrial names.
Media underperformed other sectors, as selling pressure weighed on Publicis Groupe and Springer Nature underwent a significant share placement. In Food & Beverage, Nestlé is facing selling pressure after French authorities launched anti-fraud raids, while Orkla declined after warning of profit and cost headwinds related to the Middle East conflict. Although the company reported solid snacks performance, cost inflation and margin pressure continued to weigh on sentiment.
Retail also underperformed despite a strong session for Marks & Spencer, supported by an upgrade in profit guidance and structural margin expansion. However, valuation concerns and a weaker fiscal outlook weighed on B&M and Rusta, both of which have been downgraded by brokers. Market attention has also turned to reports that the UK Treasury was urging supermarkets to cap food prices, although this was later denied by a UK minister.
Other Global Stock Indices Price Performance
MSCI World Index +2.27% MTD and +7.59% YTD
Hang Seng -0.49% MTD and +0.08% YTD
Over the past seven days, the MSCI World Index and Hang Seng Index are -0.23% and -2.79%, respectively.
Currencies
EUR -0.91% MTD and -1.03% YTD to $1.1624
GBP -1.24% MTD and -0.28% YTD to $1.3435
The US dollar retreated on Wednesday after reaching a six-week high earlier in the session.
The dollar index fell -0.19% to 99.14, while the euro rose +0.15% to $1.1624. Over the past week, the dollar index is up +0.66%. The euro declined -0.73% on a weekly basis.
Sterling also strengthened, gaining +0.28% to $1.3435. However, over the past week, the pound fell -0.63% against the US dollar.
The dollar’s recent appreciation has pushed the yen back toward the ¥160-per-dollar level, which last month prompted Japanese authorities to carry out their first currency market intervention in nearly two years.
The Japanese yen was up +0.10% against the dollar at ¥158.87 per dollar. Over the past week, the yen has fallen -0.63% against the US dollar. The yen has depreciated -1.48% MTD and -1.42% YTD against the greenback.
According to Reuters sources, Tokyo intervened several times at the end of April and in early May to slow the yen’s decline, although the currency’s subsequent strength proved short-lived.
Note: As of 5:00 pm EDT 20 May 2026
Cryptocurrencies
Bitcoin +1.91% MTD and -11.42% YTD to $77,681.75
Ethereum -5.36% MTD and -28.32% YTD to $2,134.94
Bitcoin was -2.49% over the last seven days and Ethereum was -5.64%. On Wednesday, Bitcoin was +0.94% and Ethereum +0.81%. Cryptocurrencies fell over the past week as bond yields rose around the globe on concerns about rising inflationary pressures due to the ongoing war in Iran and the increased consequent risk of central bank rate rises. Cryptocurrencies were also negatively affected by profit-taking and slowing Spot ETF momentum as Spot Bitcoin ETFs saw about $1 bn in net outflows, ending six weeks of inflows.
However, with investors rotating out of stressed bond markets and a potential softening of stock markets as investors become ever more wary of the impact of inflation on margins, cryptocurrencies may be able to absorb some of the risk capital that has been held in cash.
Note: As of 5:00 pm EDT 20 May 2026
Fixed Income
US 10-year yield +21.7 bps MTD and +42.0 bps YTD to 4.592%
German 10-year yield +5.5 bps MTD and +23.6 bps YTD to 3.096%
UK 10-year yield -3.0 bps MTD and +51.5 bps YTD to 4.993%
US Treasury yields declined on Wednesday, reversing the previous session’s gains as hopes increased that the US may be near a deal with Iran that will end the war and open the Strait of Hormuz. Reuters reported that President Donald Trump said that negotiations with Iran were in the final stages, while warning of further attacks unless Iran agrees to a deal. Two Chinese oil tankers were reported to have passed through the Strait on Wednesday.
The 10-year Treasury yield fell -7.9 bps to 4.567%, after reaching 4.687% on Tuesday, its highest level since January 2025.
The 30-year Treasury yield declined -5.5 bps to 5.128%. It briefly touched 5.197% on Tuesday, its highest level since July 2007, prior to the global financial crisis.
The 2-year Treasury yield, which is particularly sensitive to changes in Fed funds rate expectations, fell -5.9 bps to 4.068%.
The Treasury Department sold $16 billion of 20-year bonds on Wednesday. Demand was somewhat soft, with the auction drawing a bid-to-cover ratio of 2.55x. Following the auction, the 20-year Treasury yield moved lower and was down -7.7 bps at 5.123%.
The US Treasury yield curve, measured by the spread between yields on two- and 10-year Treasury notes, stood at 52.4 bps, 4.0 bps wider than the previous week’s 48.4 bps.
The US yield curve bear steepened over the course of the week. At the front-end, the 2-year yield was +7.8 bps higher over the past seven days, the 10-year yield advanced by +11.8 bps, and at the longer end, the 30-year yield traded +9.0 bps higher.
According to CME Group's FedWatch Tool, Fed funds futures traders are now pricing in a 2.7% probability of a 25 bps rate cut at June’s FOMC meeting, compared to 1.0% from last week. Fed funds futures traders are pricing in 16.5 bps of rate hikes in 2026, higher than the 9.4 bps of rate hikes priced in a week ago.
Across the Atlantic, in the UK, softer-than-expected inflation supported sentiment, although the broader outlook remains constrained by elevated energy prices.
Britain’s 10-year Gilt yield fell -13.6 bps to 4.993%. On a weekly basis, the 10-year Gilt yield is down -9.1 bps.
Across the English channel, eurozone government bond yields moved lower on Wednesday after testing multi-year highs earlier in the week, as markets continued to weigh the prospect of further central bank tightening in response to inflationary pressure stemming from higher energy prices.
Germany’s 10-year Bund yield fell -9.7 bps to 3.096%, after rising as high as 3.200% on Tuesday, its highest level in 15 years.
At the same time, governments globally are introducing fiscal measures to cushion the impact of higher oil prices, a development that could add pressure to the long end of the curve. In Germany, this has included fuel tax cuts announced last month.
Germany’s 30-year Bund yield declined -7.1 bps to 3.629%, after reaching 3.716% on Tuesday, its highest level since mid-2011.
Rate expectations have also adjusted sharply since the start of the war. Before the conflict, markets expected the ECB to keep the Deposit Facility Rate relatively unchanged through 2026; by contrast, current pricing now implies at least two 25 bps rate increases.
Germany’s two-year Schatz yield, sensitive to changes in near-term rate expectations, fell -10.8 bps to 2.659%.
Italy’s 10-year BTP yield declined -13.0 bps to 3.834%, leaving the spread over Bunds at 73.8 bps, or 2.5 bps tighter than last week’s 76.3 bps. Over the past seven days, the 10-year BTP yield has fallen by -3.2 bps.
France’s 10-year OAT yield fell -11.6 bps on Wednesday to 3.713%, bringing the spread over Bunds to 61.7 bps, down 2.9 bps from last week’s 64.6 bps. The French 10-year OAT yield fell by -3.6 bps over the week.
During the past week, the German yield curve bull steepened as short-term yields fell faster than long-term yields. Over the course of the past seven days, the two-year Schatz yield traded -5.9 bps lower, while yield on the 10-year bund declined by -0.7 bps. At the longer end of the spectrum, the 30-year German yield moved -0.1 bps lower.
The yield spread between German Bunds and 10-year UK gilts reached 189.7 bps on Wednesday, a decrease of 8.4 bps over the past seven days.
The spread between US 10-year Treasuries and German Bunds is now 149.6 bps, an increase of 12.5 bps from last week’s 137.1 bps.
Commodities
Gold spot -1.70% MTD and +5.31% YTD to $4,543.14 per ounce
Silver spot +2.89% MTD and +6.47% YTD to $75.87 per ounce
West Texas Intermediate crude -6.01% MTD and +72.58% YTD to $99.08 a barrel
Brent crude -7.55% MTD and +73.17% YTD to $105.48 a barrel
Gold prices rose by more than one percent on Wednesday, recovering from earlier weakness in the session.
Spot gold advanced +1.39% to $4,543.14 per ounce, after falling earlier in the session to its lowest level in more than seven weeks. On a weekly basis, the metal remained down -3.14%.
Spot silver rose +2.84% to $75.87 per ounce, although it is down -13.24% over the past week.
Oil prices fell by more than four percent on Wednesday following reports from the Middle East that Tehran and Washington were finalising the text of a potential agreement, with an announcement possibly expected within hours. Both benchmarks extended losses after the US President said, ‘We are in final stages of talks with Iran, we will see what happens.’
Brent crude futures settled down $5.51, or -4.96%, at $105.48 a barrel, while US WTI crude futures declined by $4.95, or -4.76%, to $99.08 a barrel. Over the past week, WTI is -1.70% and Brent is -0.36%.
The US President said negotiations with Iran had entered the final stage, while also warning of further attacks unless Tehran agreed to a deal. Iranian foreign ministry spokesperson Esmaeil Baghaei said Tehran was prepared to develop protocols for safe shipping traffic in cooperation with other coastal states, although no further details were provided.
Despite signs of progress, market participants and analysts remained cautious over the outcome of the negotiations and the likelihood that global supply tightness would persist even if Washington and Tehran reached an agreement.
The premium of Brent contracts for delivery next month over those for delivery in six months, a key indicator of perceived near-term supply tightness, stood at around $20 a barrel, down from highs above $35 reached last month.
Russian Deputy Prime Minister Alexander Novak said on Wednesday that some countries were lifting sanctions on Russian oil because global markets could not function without it, according to state news agency TASS.
Three supertankers were transiting the Strait of Hormuz on Wednesday carrying oil bound for Asian markets, after remaining in the Gulf for more than two months with 6 million barrels of Middle Eastern crude on board. Even so, traffic through the strait remained well below the roughly 130 vessels per day recorded before the war.
The UAE said the recently announced plan to increase exports via the West-East pipeline, in order to avoid transit through the Strait of Hormuz, was 50% complete. Additionally, ADNOC’s CEO added that it would take at least four months to restore crude flows to 80% of pre-conflict levels.
To offset the supply shortfall, countries have continued to rely on both commercial and strategic inventories.
Kpler data showed that month-to-date crude imports to China were down by 1.222 million bpd to 6.766 million bpd, while imports to most other major Asian buyers were tracking higher. The increase was led by South Korea, up 936,000 bpd m/o/m to 2.560 million bpd, and Japan, up 694,000 bpd m/o/m to 1.411 million bpd.
Ukraine struck another Russian refinery overnight, while Reuters sources said that virtually all major refineries in central Russia had been forced either to halt or to scale back fuel output following recent drone attacks.
EIA report. The latest US Energy Information Agency (EIA) report, released on Wednesday, showed that US crude and gasoline inventories declined last week as demand remained firm, while distillate stockpiles increased.
For the week ended 15 May, US crude inventories fell by 7.9 million barrels to 445.0 million barrels, the EIA reported.
At the Cushing, Oklahoma delivery hub, crude stocks declined by 1.6 million barrels over the week. The EIA also reported that crude oil exports from the US Strategic Petroleum Reserve fell by 9.9 million barrels, marking the largest weekly decline on record.
Net US crude imports rose by 3,000 barrels per day (bpd) last week, while exports increased by 112,000 bpd to 5.6 million bpd. US crude exports remained well supported as overseas demand strengthened to offset supply disruptions linked to the war with Iran.
Refinery crude runs declined by 80,000 bpd during the week, while refinery utilisation edged 0.1 percentage points lower to 91.6%, according to the EIA.
Gasoline demand remained relatively resilient, analysts said, defying concerns over demand destruction even as pump prices hovered near their highest level in four years. They cautioned that continued inventory drawdowns could become more problematic as the US approaches the summer driving season, when gasoline consumption typically increases.
US gasoline inventories fell by 1.5 million barrels over the week to 214.2 million barrels.
Total product supplied, a proxy for demand, increased by 558,000 bpd to 20.45 million bpd, while gasoline consumption edged higher week on week to 8.77 million bpd.
Distillate inventories, including diesel and heating oil, rose by 372,000 barrels during the week to 102.9 million barrels, according to EIA data.
Note: As of 5:00 pm EDT 20 May 2026
Key data to move markets
EUROPE
Thursday: German, French and Eurozone HCOB Composite, Services and Manufacturing PMIs and German Bundesbank “Buba” Monthly Report
Friday: German GfK Consumer Confidence, German GDP, EcoFin Meeting, Eurogroup Meeting, German IFO Business Climate, Current Assessment and Expectations Surveys and a speech by ECB Chief Economist Philip Lane
Saturday: EcoFin Meeting
Wednesday: A speech by ECB Chief Economist Philip Lane
UK
Thursday: S&P Global Composite, Services and Manufacturing PMIs and a speech by BoE External Member Alan Taylor
Friday: GfK Consumer Confidence and Retail Sales
USA
Thursday: Initial and Continuing Jobless Claims, Building Permits, Housing Starts, S&P Global Services, Manufacturing and Composite PMI, Philadelphia Fed Manufacturing Survey and a speech by Richmond Fed Thomas Barkin
Friday: Fed Chair Kevin Warsh swearing-in ceremony, Michigan Consumer Sentiment and Expectations Indices, UoM 1- and 5-year Consumer Inflation Expectations and a speech by Fed Governor Christopher Waller
Monday: Markets closed for Memorial Day holiday
Tuesday: Housing Price Index, Consumer Confidence, Dallas Fed Manufacturing Index and a speech by Minneapolis Fed President Neel Kashkari
Wednesday: ADP Employment Change 4-week average and speeches by Fed Vice Chair Phillip Jefferson and Chicago Fed President Austan Golsbee
JAPAN
Thursday: Adjusted Merchandise Trade Balance, Merchandise Trade Balance, Imports and Exports, National CPI and Core CPI
Tuesday: BoJ Governor Kazuo Ueda’s speech
While every effort has been made to verify the accuracy of this information, EXT Ltd. (hereafter known as “EXANTE”) cannot accept any responsibility or liability for reliance by any person on this publication or any of the information, opinions, or conclusions contained in this publication. The findings and views expressed in this publication do not necessarily reflect the views of EXANTE. Any action taken upon the information contained in this publication is strictly at your own risk. EXANTE will not be liable for any loss or damage in connection with this publication.
This article is provided to you for informational purposes only and should not be regarded as an offer or solicitation of an offer to buy or sell any investments or related services that may be referenced here. Trading financial instruments involves significant risk of loss and may not be suitable for all investors. Past performance is not a reliable indicator of future performance.


Created by professionals. For professionals.
