
What could happen at the Beijing summit?

What to look out for today
Companies reporting on Monday, 11 May: AST SpaceMobile, Barrick Mining, CleanSpark, Fox Corp, Mara Holdings
Key data to move markets today
USA: Existing Home Sales
CHINA: CPI and PPI
Global Macro Updates
April NFP. April headline nonfarm payrolls (NFP) rose by 115,000, above the 62,000 consensus. March payrolls were revised up to 185,000 from 178,000, while February was revised down by 23,000 to 156,000. The three-month average stands at 48,000, broadly consistent with estimates of the breakeven pace of job growth.
Job gains remained concentrated in healthcare and social assistance (54,000), although this was below March’s strong 91,000. The report also cited increases in transportation and warehousing (30,000) and retail trade (22,000). Federal employment declined by 9,000, while information-sector jobs fell for a 16th consecutive month; financial-sector employment also declined, marking the third drop in the past four months.
The unemployment rate remains a key input for monetary policy. It held at 4.3% as expected; however, on an unrounded basis it rose to 4.337% from March’s 4.256%. The labour-force participation rate edged down to 61.8% from 61.9% and is now down 100 bps since November 2023, remaining below the pre-COVID baseline. The release reported little m/o/m change in discouraged workers or in those marginally attached to the labour force. Part-time employment for economic reasons increased by 445,000 to a year-to-date high of 4.94 million, though it remains below late-2025 levels.
Average hourly earnings increased 0.2% m/o/m, matching March, but below the 0.3% consensus. Previews had anticipated some rebound from the prior month’s softer reading, though calendar effects were expected to keep gains contained. Average weekly hours ticked up to 34.3 from 34.2 and have largely remained within this range since early 2024.
Analysts generally expect that last Friday’s report will have limited impact on rate expectations. Fed funds pricing continues to imply no rate cuts through 2026. At the 29-Apr FOMC meeting, Fed Chair Powell noted that the labour market has shown further signs of stability and added that, during the intermeeting period, the number of participants viewing the next policy move as more likely a hike than a cut increased.
A record-low UMich consumer sentiment. Preliminary University of Michigan consumer sentiment registered at 48.2 (vs. 49.5 consensus and April’s 49.8), marking a second consecutive monthly record low. Inflation concerns remained the primary driver of weakness with roughly one-third of respondents spontaneously citing gasoline prices as a major concern and about 30% referenced tariffs.
One-year inflation expectations eased to 4.5% from 4.7% in the prior month, while long-run inflation expectations edged down to 3.4% from 3.5%.
Within the survey, the Current Economic Conditions Index fell to 47.8 from 52.5, while the Index of Consumer Expectations rose to 48.5 from 48.1.
US Stock Indices
Dow Jones Industrial Average +0.02%
Nasdaq 100 +2.35%
S&P 500 +0.84%, with 6 of the 11 sectors of the S&P 500 up
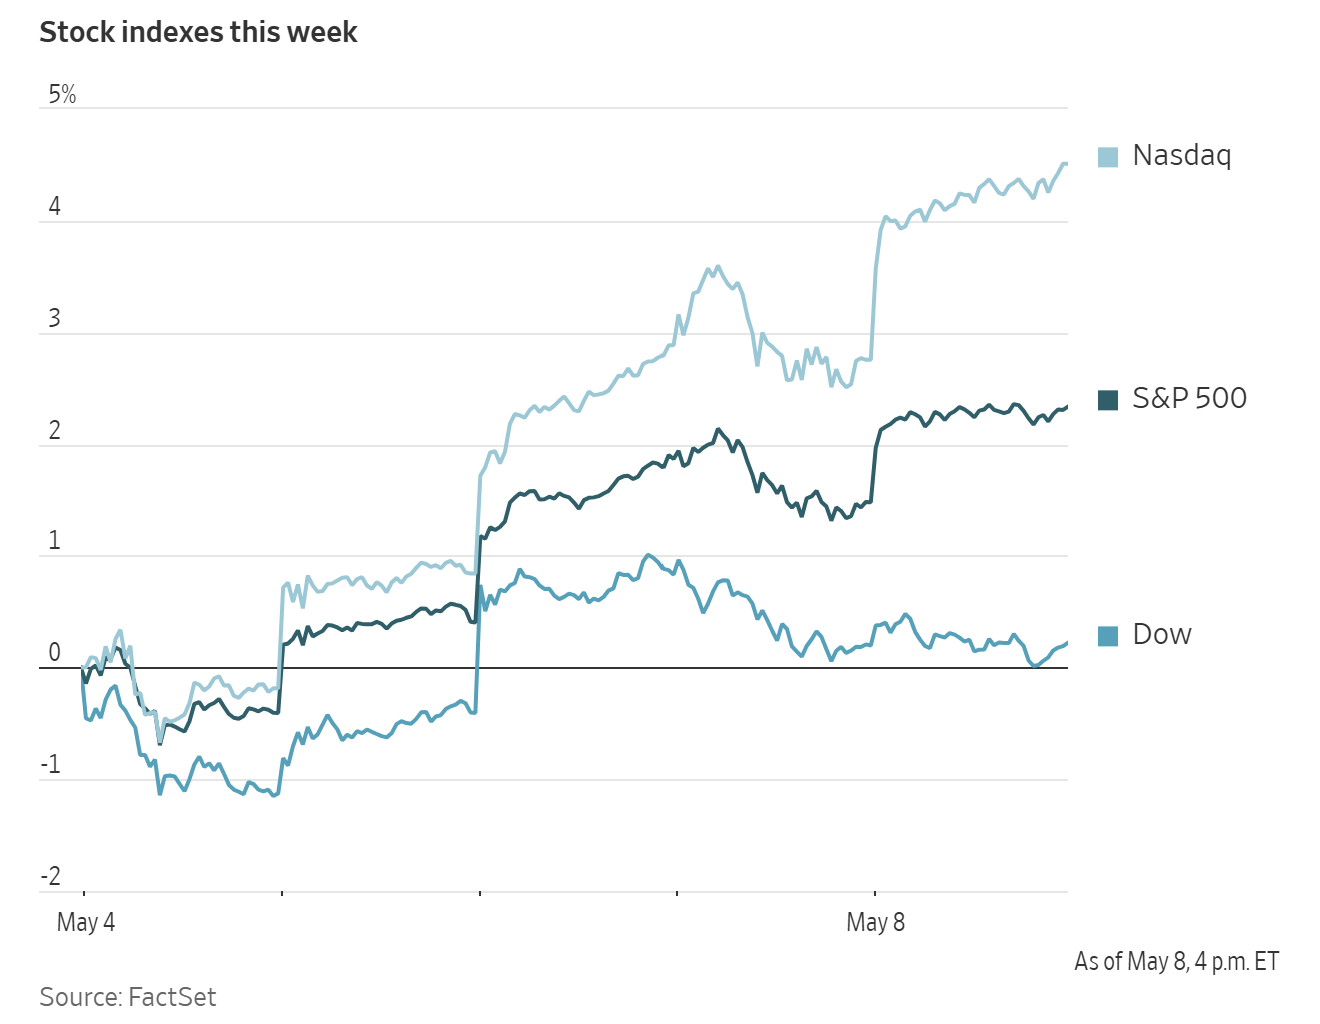
US equities advanced to fresh highs, supported by a stronger-than-expected employment report and the continued momentum in semiconductor shares.
The Nasdaq Composite added +1.71%, recording its 11th record close of 2026. The S&P 500 gained +0.84% and also ended at a new high of 7,398.93, while both indexes extended their winning streaks to six consecutive weeks. The Dow Jones rose +12.16 points, or +0.02%.
For the week, the S&P 500 advanced +2.75%, the Nasdaq Composite rose +4.70%, and the Dow Jones Industrial Average increased +1.36%.
According to LSEG I/B/E/S data, y/o/y earnings growth for the S&P 500 in Q1 2026 is projected to be +28.6%. This jumps to +30.0% when excluding the Energy sector. Of the 440 companies in the S&P 500 that have reported earnings to date for Q1, 83.2% have reported earnings above analyst estimates, with 78.4% of companies reporting revenues exceeding analyst expectations. The y/o/y revenue growth is projected to be 11.0% in Q1, increasing to 11.6% when excluding the Energy sector.
Information Technology at 98.1%, is the sector with most companies reporting above estimates. Additionally, Energy with a surprise factor of 19.6%, is the sector that has beaten earnings expectations by the highest surprise factor. Within Communication Services, 41.2% of companies have reported below estimates. It is also the sector with the smallest surprise factor, exceeding estimates by 2.2%. The S&P 500 surprise factor is 8.1%. The forward four-quarter price-to-earnings ratio (P/E) for the S&P 500 sits at 21.1x.
9 S&P 500 companies are scheduled to release their Q1 earnings reports this week.
In corporate news, Intel shares rose on Friday, extending earlier gains after The Wall Street Journal reported that the company reached an agreement with Apple to manufacture certain chips used in its devices. The deal adds another chapter to Intel’s yearlong turnaround narrative.
Nvidia is investing up to $2.1 billion in IREN as part of a broader partnership intended to accelerate the build-out of AI infrastructure.
Anthropic has reportedly signed a $1.8 billion computing agreement with cloud-services provider Akamai Technologies to meet surging demand for its AI software, according to people familiar with the matter. Akamai was the best-performing stock in the S&P 500 on the day.
Cerebras Systems is expected to raise the price range of its initial public offering as soon as Monday, according to people familiar with the matter, as reported by Bloomberg news, as demand for the AI chipmaker’s shares continues to build.
S&P 500 Best performing sector
Information Technology +2.74%, with Akamai Technologies +26.58%, Micron Technology +15.49% and Intel +13.96%
S&P 500 Worst performing sector
Utilities -0.91%, with Vistra -4.05%, NRG Energy -2.64% and Constellation Energy -2.46%
Mega Caps
Alphabet +0.44%, Amazon +0.56%, Apple +2.05%, Meta Platforms -1.16%, Microsoft -1.38%, Nvidia +1.75% and Tesla +4.02%
Information Technology
Best performer: Akamai Technologies +26.58%
Worst performer: Motorola Solutions -11.36%
Materials and Mining
Best performer: International Flavors & Fragrances +3.57%
Worst performer: Mosaic -3.14%
Corporate Earnings Reports
Posted on Friday, 8 May
PPL quarterly revenue +10.8% to $2.774 bn vs $2.508 bn estimate
EPS at $0.63 vs $0.62 estimate
Vincent Sorgi, President and CEO, said, “Our first-quarter results reflect strong financial and operational results and keep us on track to achieve our 2026 earnings guidance range. We’re on pace to complete $5.1 billion in 2026 infrastructure investments to strengthen and modernize our electric and gas networks, build new generation resources in Kentucky and improve customer service while maintaining affordability for our customers.” — see report.
European Stock Indices
CAC 40 -1.09%
DAX -1.32%
FTSE 100 -0.43%
Commodities
Gold spot +0.63% to $4,714.41 an ounce
Silver spot +2.35% to $80.32 an ounce
West Texas Intermediate -3.05% to $94.68 a barrel
Brent crude -2.51% to $100.48 a barrel
Gold prices edged higher on Friday and finished the week with gains, as optimism about a potential end to the Iran conflict tempered concerns over inflation and the prospect of persistently elevated interest rates.
Spot gold rose +0.63% to $4,714.41 per ounce and ended the week up +2.18%.
Physical demand in India remained subdued as the rebound in prices prompted prospective buyers to delay purchases, while premiums in China were steady amid continued safe-haven demand.
Spot silver climbed +2.35% to $80.32 per ounce and advanced +6.62% over the week.
Brent crude futures rose by as much as three percent on Friday, one day after the US and Iran exchanged air strikes, but later pared those gains and turned negative as traders expressed hope for an extended pause in hostilities that has disrupted shipping through the Strait of Hormuz (SoH).
Brent settled at $100.48 per barrel, down $2.59, or -2.51%. US WTI futures closed at $94.68 per barrel, down $2.98, or -3.05%.
Both benchmarks recorded weekly declines of more than seven percent, with WTI down -7.63% and Brent down -7.68%.
This was crude’s largest weekly decline of the war, as the US and Iran moved closer to a one-page Memorandum of Understanding (MoU) delivered via Pakistani intermediaries). This MoU would establish a 30-day window for talks, during which Iran would ease its hold on the Strait and the US would ease the blockade. Uranium enrichment, the removal of Iranian stockpiles, and Iranian control of the SoH remain key sticking points.
Iran had 2 days to review the MoU, with the US President threatening renewed strikes if the window is missed. Selling accelerated mid-week after Iran’s demand for Strait of Hormuz transit fees and war reparations was rejected outright. The ceasefire largely held despite an exchange in which CENTCOM struck Iranian launch sites and C2 nodes after Iran attacked three US destroyers transiting the Strait, with the US President characterising the response as a ‘love tap.’ President Donald Trump and Iran have now rejected each other’s latest peace proposals with President Trump, writing on Truth Social, that “I have just read the response from Iran’s so-called “Representatives, I don’t like it — TOTALLY UNACCEPTABLE!”. According to a report from The Wall Street Journal, Iran offered to transfer some of its stockpile of highly enriched uranium to a third country, but rejected the idea of dismantling its nuclear facilities. Iran’s semi-official news agency Tasnim said the report on proposals for handling nuclear material was “not true.”
On Friday, the US military carried out airstrikes against multiple empty Very Large Crude Carrier (VLCCs) attempting to return to Iranian ports, marking the third use of force against commercial vessels since the April blockade began.
Rystad estimated that ~600 million barrels of supply have already been lost, with the total potentially reaching 1.2 to 2.0 billion barrels before normalization. Analysts flagged global stockpiles as approaching eight-year lows, while Shell estimated the global shortfall at close to 1 billion barrels and widening on a daily basis.
Libya halted crude loadings from Zawia port and shut its 120,000 barrels per day (bpd) Zawia refinery following armed clashes. Ukraine struck two Russian refineries and a nearby oil pumping station, adding pressure to already multi-year-low Russian refinery runs.
Saudi Aramco cut June OSPs (Official Selling Price) across the board, lowering Arab Light to Asia by $4.00/bbl to a $15.50 premium versus Oman-Dubai.
Jet fuel remained the focal point. Global seaborne jet fuel exports fell to 1.1 million bpd in April, a 10-year seasonal low (down 630,000 bpd y/o/y), and jet/kero cracks are expected to remain elevated until Middle East flows normalize. The DOE Weekly Petroleum Status Report showed draws in crude (2.31 million), gasoline (2.50 million), and distillate (1.29 million), alongside a 5.2 million Strategic Petroleum Reserve (SPR) release, with total product and distillate exports setting new records.
The EIA Short-Term Energy Outlook is scheduled for release on 12 May, with the IEA and OPEC Monthly Oil Reports also due this week.
Note: As of 4 pm EDT 8 May 2026
Currencies
EUR +0.51% to $1.1784
GBP +0.64% to $1.3632
Bitcoin +0.65% to $80,249.66
Ethereum +1.11% to $2,314.23
The US dollar eased on Friday, extending its decline for a second consecutive week as investors remained cautiously optimistic about a swift end to the Middle East conflict.
The dollar index slipped -0.41% to 97.84 after touching 97.623 earlier in the week, its lowest level since 27 February, the day before the war began. For the week, the index fell -0.37%.
The euro rose +0.51% to $1.1784 and finished the week +0.55% higher against the greenback.
Sterling advanced on Friday after British Prime Minister Keir Starmer said he would not resign despite significant losses for the ruling Labour Party in local elections. The pound rose +0.64% to $1.3632 and gained +0.44% over the week.
The US currency was little changed after Friday’s data showed US employment increased more than expected in April, while the unemployment rate held steady at 4.3%. The figures underscored labour-market resilience and reinforced expectations that the Fed will keep interest rates unchanged for the foreseeable future.
Attention remained on the Japanese yen, as recent interventions and repeated warnings from Tokyo helped deter aggressive selling. The dollar was -0.11% lower on Friday at ¥156.65.
Japan’s top currency diplomat said on Thursday that Japan faces no constraints on how often it can intervene in currency markets and remains in daily contact with US authorities. Over the week, the yen strengthened +0.24% against the US dollar.
Fixed Income
US 10-year Bond -3.6 basis points to 4.359%
German 10-year Bund -0.2 basis points to 3.007%
UK 10-year gilt -4.7 basis points to 4.912%
US Treasury yields declined on Friday after a stronger-than-expected payrolls report modestly reduced expectations that the Federal Reserve will raise rates this year.
The 10-year Treasury yield fell -3.6 bps to 4.359% and ended the week -2.0 bps lower, marking its first weekly decline after two consecutive weeks of gains.
The 30-year Treasury yield declined -3.5 bps to 4.936%, contributing to a weekly drop of -2.8 bps, its first weekly decline in three weeks.
The Treasury curve spread between 2-year and 10-year yields stood at 46.4 bps, 2.3 bps narrower than the prior week’s 48.7 bps.
The 2-year Treasury yield, which typically tracks expectations for the Fed fund rates, fell -1.8 bps to 3.895% and was +0.3 bps higher on the week.
According to CME Group's FedWatch Tool, Fed funds futures traders are pricing 0.0 bps of rate cuts in 2026, lower than the 1.0 bps priced in a week ago. Fed funds futures traders are now pricing in a 6.2% probability of a 25 bps rate cut at June’s FOMC meeting, lower than last week’s 6.7% probability.
Short-dated eurozone government bond yields edged higher on Friday, although price action was comparatively subdued versus the volatility seen earlier in the week.
Germany’s 2-year yield rose +1.5 bps to 2.598%, extending gains for a second session after Wednesday’s largest daily decline in a month. For the week, the 2-year Schatz yield fell -5.2 bps. The 10-year Bund yield was -0.2 bps lower on the day at 3.007%, after trading -3.4 bps lower last week. At the long end, the 30-year yield eased -0.2 bps on Friday and was -0.3 bps lower over the week.
ECB Executive Board member Isabel Schnabel warned on Thursday about the increasing risk of higher inflation in the wake of the Iran war, as well as the ‘quiet erosion’ of central-bank independence at a time of rising global debt.
Economic data showed that German exports rose unexpectedly in March, while industrial output declined despite forecasts calling for an increase.
Money markets indicate that traders are assigning roughly a 57% probability of no policy change at the ECB’s next meeting in June, a reversal from last week when the majority were pricing in a hike.
Italy’s 10-year yield was unchanged at 3.732%, leaving the spread over Bunds at 72.5 bps, 9.0 bps tighter than the prior week’s 81.5 bps.
UK gilts were in focus after British Prime Minister Keir Starmer’s Labour Party suffered significant losses in local elections. Gilts outperformed major peers, with the 10-year yield down -4.7 bps to 4.912%, after Starmer vowed to remain in office to ‘deliver change.’ For the week, the 10-year yield declined -5.9 bps.
Note: As of 4 pm EDT 8 May 2026
While every effort has been made to verify the accuracy of this information, EXT Ltd. (hereafter known as “EXANTE”) cannot accept any responsibility or liability for reliance by any person on this publication or any of the information, opinions, or conclusions contained in this publication. The findings and views expressed in this publication do not necessarily reflect the views of EXANTE. Any action taken upon the information contained in this publication is strictly at your own risk. EXANTE will not be liable for any loss or damage in connection with this publication.
This article is provided to you for informational purposes only and should not be regarded as an offer or solicitation of an offer to buy or sell any investments or related services that may be referenced here. Trading financial instruments involves significant risk of loss and may not be suitable for all investors. Past performance is not a reliable indicator of future performance.


Created by professionals. For professionals.
