

Alpha Vibes - The new price of AI growth



Renée Friedman, Global Head of Research

Horacio Coutino, Multi-asset Strategist
What earnings season revealed about the seven investable layers of AI
In June we wrote about the AI buildout. We organised it into seven investable layers: fabrication tools and process materials, memory, compute, networking, physical infrastructure, power and applications. We then built concentrated baskets of listed companies that best captured each layer’s signal. Using forward EPS, EBITDA, FCF margins and EV/EBITDA, it showed that earnings power and valuation have re-rated unevenly across the buildout. The article, The Architecture of Disruption, posed the questions of which layer to own and at what price. We now have some answers. There has been an uneven but measurable conversion of AI investment into revenue. There is now evidence of where hyperscaler capital expenditure (CapEx) is flowing through to suppliers, where it remains in backlog and where valuations still demand faith rather than concise conversion.
After an exceptional first-half rally, guidance now matters more than the print, and the second derivative more than the beat. Microsoft and Amazon provided the cleanest proof that elevated CapEx can coincide with near-term monetisation. Meta illustrated the market’s intolerance for CapEx-heavy stories whose Return on Invested Capital (RoIC) is still a promise. Nvidia's Q2 acted as the season's clearing event. A beat-and-raise that de-risked the near-term trade and lifted the entire Compute & Silicon layer's forward earnings.
What is now clearer is that conversion is now favoured much more than aspiration. Markets are repricing risk and there is greater dispersion in performance amongst the seven layers. The seven-layer architecture remains the right lens. Q2 results revealed distinct constraints, earnings cadences and valuation burdens across each buildout layer.
The updated read for the seven layer taxonomy is straightforward:
• Layer 1: Fabrication Equipment & Process Materials (L1 FE + PM) confirmed that memory and advanced packaging are accelerating together. A further upward revision to wafer-fab-equipment (WFE) estimates has lengthened the toll-collector's order book.
• Layer 2: Memory & Storage (L2 M & S) is still the strongest near-term earnings inflection, and, since Nvidia's print, is recovering the summer's de-rating.
• Layer 3: Compute & Silicon (L3 C + S) is broadening beyond a single-name trade, but remains anchored by Nvidia.Layer 4: Networking (L4 N) has shifted from a demand question to a supply-and-conversion question.
• Layer 5: Site-Readiness & Physical Infrastructure (L5 SR + PI) is full on orders, but mixed on revenue timing.
• Layer 6: Power & Electrification (L6 P + E) is increasingly where scarcity becomes monetisation.
• Layer 7: Applications (L7 A) are now producing enough enterprise revenue to serve as a partial underwriting mechanism for the layers beneath them. This is something Meta's newly launched AI product, Muse, will test.
How the narrative changed
In June we argued that AI had become a capital-intensive macro and industrial story whose implications reached bond markets, power grids and the commodity space. Q2 earnings reinforced that macro outlook. The Street’s $754 billion hyperscaler CapEx estimate for the year is now reading as a floor. The question now is how quickly is hyperscaler CapEx converting across each physical node and potentially justifying its multiple?
Three developments matter.
First, the platforms stopped behaving as a single bloc. Microsoft reported Azure growth in line with guidance, over 30 million paid Copilot seats and a lower calendar 2026 CapEx forecast after extending useful lives. The market read this as evidence that AI demand is already generating same-cycle revenue. Amazon delivered its fastest AWS growth in eighteen quarters, with AWS revenue of $42.232 billion and operating margin of 39.4%, even as trailing twelve-month FCF turned negative. This demonstrated that investors will tolerate cash absorption if cloud monetisation is visible enough. Meta, by contrast, showed that strong top-line growth is insufficient when CapEx expands faster than the market’s confidence in its return. Muse, its newly launched AI product, is Meta’s clearest effort yet to turn its CapEx in compute into revenue. Nevertheless, an agent with access to payments, health data, communications and personal calendars has a risk profile fundamentally different from a chatbot. The internal failures reported before launch reveal that the Application layer’s next growth vector may also become its principal regulatory and reputational constraint.
Second, the supply chain has moved beyond a supporting role. It now provides the clearest evidence supporting the AI theme. AMD, Arista, Cisco, Sandisk, Qnity, Coherent, Lumentum and Applied Materials each provided distinct confirmation that demand is broad, physical and, in several areas, constrained by capacity. As a result, the narrative has become more granular than it was in late June. AI remains a macro story, although the strongest signal has shifted from CapEx announcements to bookings, backlog conversion, segment mix, margin structure and trajectory and FCF discipline.
Third, Nvidia's print resolved the season's central tension. Coming in ahead of the consensus estimates across all metrics that mattered. Revenue was anticipated to be $92 billion, with Data Centre revenue of $86 billion, and gross margin around 75%, coupled with Q3 guidance revenue projected at ~$104 billion. The print cleared the exacting bar the market had set and de-risked hyperscaler spending intentions into 2027. Attention has since moved to the Vera Rubin cadence, memory-cost pass-through and the durability of that guidance rather than to the level of demand itself.
The call by Anthropic’s Dario Amodei for the pace of frontier-model development to slow, supported by OpenAI’s Sam Altman and xAI’s Elon Musk, is creating an inflection point. The safety case deserves serious consideration, but the apparent consensus should be treated critically. The gesture sits awkwardly against the evidence.
Slower frontier progress does not necessarily imply lower AI spending. A shift away from maximising model capability at any cost could extend model-replacement cycles. It could simultaneously accelerate spending on inference, security, evaluation, sovereign deployments and enterprise integration. Additionally, it could also strengthen the competitive position of incumbent laboratories by making compliance scale-intensive. Safety coordination may be necessary, but coordination among direct competitors should not be mistaken for a socially neutral outcome. It can function as risk management, industrial policy and a barrier to entry at the same time.
Layer 1: Fabrication Equipment & Process Materials
This layer has become more constructive since 29 June because the Q2 season confirmed that the AI CapEx cycle is no longer confined to leading-edge logic. Dynamic Access Random Memory (DRAM), NAND flash memory and advanced packaging spending are being pulled higher at the same time. Applied Materials delivered the cleanest read. Fiscal Q3 revenue rose to a record $9.115 billion, EPS reached $3.50, gross margin expanded to 50.4%, FCF rebounded to $2.330 billion from $210 million, and management guided the next quarter to roughly $10.25 billion, above prior consensus. The key signal was the composition of the beat: the memory cycle that earlier reports had framed as the market’s critical question did, in fact, drive the upside. It reinforced the argument that High Bandwidth Memory (HBM), DRAM and NAND are now moving together rather than sequentially.
That matters for expectations. In our initial framework, fabrication was the toll-collector layer. It was relatively insulated from which chip vendor ultimately prevailed, but dependent on the intensity of process complexity. Q2 strengthened that logic. Qnity’s results showed real-time consumables demand moving with wafer starts, while its Interconnect Solutions segment confirmed that advanced-packaging materials are scaling faster than the broader portfolio. ASML did not report inside the window, but the WFE upgrades corroborate ASML’s multi-year backlog ahead of its October print. For this layer, the main drivers to monitor after Q2 are DRAM and HBM capital intensity, advanced-packaging tool adoption, subscription-like services revenue at Applied Global Services and the degree to which foundry-logic demand remains additive instead of merely offsetting slower end markets elsewhere.
Layer 2: Memory & Storage
No layer did more to advance the earnings case for AI than Memory & Storage. Our earlier note argued that memory combined extraordinary forward EBITDA growth with low EV/EBITDA multiples because the market still doubted the durability of the cycle. Q2 earnings made that scepticism harder to sustain in the near term. Sandisk posted revenue of $8.965 billion, up 371.6% y/o/y, gross margin of 84.6% and FCF of $7.028 billion. Data Centre revenue more than doubled sequentially to $2.977 billion. Seagate had already signalled that nearline exabyte demand was effectively sold out into 2027. Applied Materials later validated that memory CapEx was flowing through to equipment orders.
The narrative shift here is from cyclical recovery to a structurally constrained upcycle. The longer-term caveat is that Memory retains more commodity characteristics than other layers. The principal drivers are now more clearly defined. Enterprise SSD demand linked to training-data staging and inference caching, HBM-related wafer demand, node migrations to more efficient 3D NAND architecture, such as 8th and 10th generations of Bit-Cost Scalable flash memory (BiCS8 and BiCS10), and the durability of long-term supply agreements. The signal to watch post-Q2 is whether pricing power can hold as capacity additions begin. This remains the layer where extraordinary earnings power is most obviously vulnerable to eventual normalisation.
Layer 3: Compute & Silicon
Compute remains the thematic anchor. However, Nvidia’s print changed the layer from a hierarchy awaiting confirmation into one with a validated anchor and a widening perimeter. Nvidia reported quarterly revenue of $96.22 billion and adjusted EPS of $2.22, both above expectations. Data Centre revenue rose 117% y/o/y to $89 billion. Its guidance for $108 billion of revenue in Q3 and approximately 70% growth in 2027 confirmed that the accelerator cycle retains considerably more forward momentum than the market had embedded before the print. The 26.6-percentage-point increase in L3’s EPS Next Twelve Months (NTM) growth estimate since 29 June reflects the magnitude of that reset.
The quality of the signal is just as important as its scale. Demand is broadening beyond the largest hyperscalers toward sovereign AI, specialised cloud providers and enterprise customers. The transition from Blackwell to Vera Rubin provides another step-up in compute density and system economics. This pushes value into adjacent layers, as Rubin requires more advanced memory, packaging, optical connectivity, cooling and power per deployed system.
AMD supplied the most important evidence of diversification. Revenue rose to $11.536 billion, Data Centre revenue reached $6.700 billion, more than double the year-earlier level. The segment now represents 58.1% of total revenue as the MI450 AI accelerator GPU and Helios rackscale AI infrastructure ramp translates into operating leverage. This was the quarter’s clearest indication that hyperscaler spending is diversifying across silicon vendors, even if the centre of gravity is still Nvidia.
Broadcom provided the second essential read. Its Q2 AI semiconductor segment revenue reached $10.8 billion, up 143.0% y/o/y. Management expects the segment’s revenue to reach $56 billion in 2026 and more than $100 billion in 2027. That reinforces our previous view that custom ASICs are hyperscalers’ main structural hedge against merchant-GPU economics.
Marvell completes the layer as a complementary proxy for custom silicon and interconnect. Its hyperscaler design wins, announced in the last three months, reveal that the merchant-versus-custom contest increasingly includes deep areas of collaboration.
There are a number of signals to track after Q2: Nvidia’s Blackwell, Vera Rubin and networking cadence, AMD’s MI350-to-MI450 transition and server CPU momentum, Broadcom’s custom accelerator and AI networking mix, any evidence that custom silicon is expanding the total compute market, and, across all three constituents, whether memory-cost inflation can be passed through into accelerator pricing without denting demand. Although compute remains the framework’s centre of gravity, the key investable question is now how value is shared among merchant GPUs, custom silicon and the costly systems that make each architecture productive.
Layer 4: Networking
Networking may be the layer whose narrative changed most between 29 June and late August. In our original note, it was conceived as the connective tissue of the cluster. After Q2, it has also become the buildout’s most explicit test of conversion. Arista reported its first-ever $3 billion quarter, with revenue of $3.036 billion, lifted its full-year guidance for the third time to $12.6 billion and grew its Etherlink AI base beyond 100 customers. This confirmed that AI fabric demand remains robust and increasingly broad-based. Cisco then provided the more nuanced institutional read. Its hyperscaler AI infrastructure orders reached $9.3 billion for the last twelve months, including $4 billion in Q2. However, order strength continues to outrun recognised revenue, illustrating the deployment lag between booking and monetisation.
Optics reinforced the same point from a different angle. Lumentum and Coherent showed that 800G and 1.6T demand remains powerful. Yet, they also highlighted that supply constraints in indium phosphide lasers, transceiver components and co-packaged optics can delay revenue conversion, even when demand is not in question. A Reuter’s report on a prospective US ban on new Chinese optical transceiver models adds a strategic layer, as domestic optical suppliers may gain share while the broader ecosystem faces a further source of bottleneck risk. The post-Q2 checklist for this layer is therefore more detailed than in June. It now includes AI order growth, deferred revenue, purchase commitments, component availability, design-win breadth beyond the largest hyperscalers and the timing with which booked demand reaches the income statement.
Layer 5: Site-readiness & Physical Infrastructure
We previously suggested that site readiness and physical deployment were emerging as the binding constraints on recognised revenue. Q2 confirmed this, but with more dispersion than some expected. Vertiv, Corning and Equinix had already shown that power-and-thermal infrastructure, fibre connectivity and colocation capacity remain scarce. Q2 results also reminded the market that full backlogs do not guarantee linear quarterly revenue recognition. Super Micro’s record order intake and improved margins underscored how intense server and rack demand remains. However, the layer still carries the most visible execution risk because revenue depends on finished halls, cooling, electrical readiness and customer deployment schedules.
The right update to the framework is not bearish, but more conditional. This layer is still indispensable, but it is where the distinction between order visibility and cash conversion is sharpest. Equinix delivered a cleaner Adjusted Funds from Operations (AFFO) print, suggesting hyperscaler self-build has not yet dented third-party colocation bookings. Digital Realty’s record leasing anchors the real-asset case. The drivers to monitor now are backlog quality, liquid-cooling mix, rack-scale solution adoption, book-to-bill, working-capital discipline and whether utilities, landlords and integrators can shorten deployment timelines sufficiently for infrastructure suppliers to convert physical demand into earnings with less slippage.
Layer 6: Power & Electrification
This layer produced the season’s clearest cash vindication and its subtlest disappointments. GE Vernova’s Q2 FCF of $5.107 billion exceeded all of 2025, prompting a full-year FCF-guidance raise to $11.5 billion to $12.5 billion. However, an EPS miss and a 10.5% sequential q/o/q backlog decline to $146.3 billion sent shares lower on the decelerating order second derivative. Constellation Energy beat and raised full-year EPS guidance to $11.50–12.50, its nuclear fleet running at a 93% capacity factor and the PJM auction clearing at $325/MW-day, locking in roughly $2.24 billion of forward capacity revenue. Management tied the improvement to Calpine accretion, stronger realised pricing and PJM capacity-market tailwinds. The central idea from our prior note, that electricity is the AI buildout’s binding constraint, became more investable because the scarcity is now showing up in structured contracts, capacity payments and earnings guidance.
Vistra offered a useful counterpoint. Its revenue miss and accounting noise around hedges complicated the headline, but EBITDA still grew and full-year guidance was reaffirmed. This suggested that merchant-exposed power earnings can remain directionally constructive, even if they are less tidy quarter to quarter than Constellation’s contracted model. After Q2, the key signals for this layer are the pace and pricing of hyperscaler Power Purchase Agreements (PPAs), the balance between regulated and merchant monetisation, gas-turbine and grid-equipment backlogs, nuclear capacity factors and the extent to which data-centre electricity demand can support equipment suppliers and generators at the same time.
Layer 7: Applications
Applications were the most important conceptual uncertainty in our June note because they had to justify the infrastructure underneath them. Microsoft performed convincingly, with revenue of $90.007 billion, Azure growth of 39.4% and 30 million paid Copilot seats. The market rewarded the result because Microsoft delivered the Azure beat without increasing CapEx. It even reduced its calendar 2026 estimate to $175 billion after extending data centre useful life from 15 years to 25 years. ServiceNow extended the enterprise AI adoption thread, with Now Assist’s ACV target lifted toward $1.5 billion. These are not yet numbers that fully underwrite the trillions of dollars implied by the broader AI buildout, but they are enough to show that enterprise customers are paying for AI functionality at scale rather than just piloting it.
The layer remains mixed. Microsoft’s breadth makes it the market’s strongest bridge between applications and infrastructure, although its case also rests on Azure economics that pure application vendors do not share. Salesforce remains strategically important because Agentforce and Data Cloud represent the sector’s clearest effort to shift from seat based pricing to outcome-based AI monetisation. The market, however, still needs firmer evidence that adoption is converting into durable, high-quality revenue. The indicators to watch now are paid seat growth, annual contract value, remaining performance obligations, conversion from experimentation to production deployments and whether software margins continue expanding as AI products mature.
A note on EV/EBITDA within our framework
The choice of valuation techniques used in our June publication has proven to be particularly correct after reviewing Q2 results. In the present environment, price-to-earnings multiples can misstate relative value because depreciation is increasingly being pulled upward by AI-related CapEx and because capital structures differ materially across the seven layers. EV/EBITDA is not perfect, but it is more appropriate for a cross-layer comparison. This is due to its neutral capital-structure which is less distorted by financing choices and better aligned with the operating earnings power of businesses whose cash conversion is being reshaped by a capital-intensity shock. This matters when the same assets are funded through a shifting mix of on-balance-sheet investment-grade bonds and off-balance-sheet vehicles.
EBITDA also excludes depreciation, which Q2 proved essential in a CapEx super cycle. Microsoft’s extension of data centre useful life to 25 years reduced depreciation and lifted EPS mechanically, without changing the underlying investment base. Non-operating items added further distortion. Alphabet’s $98 billion equity gain and Amazon’s $53.4 billion Anthropic mark-up made reported EPS less comparable, while EBITDA provided a cleaner operating measure.
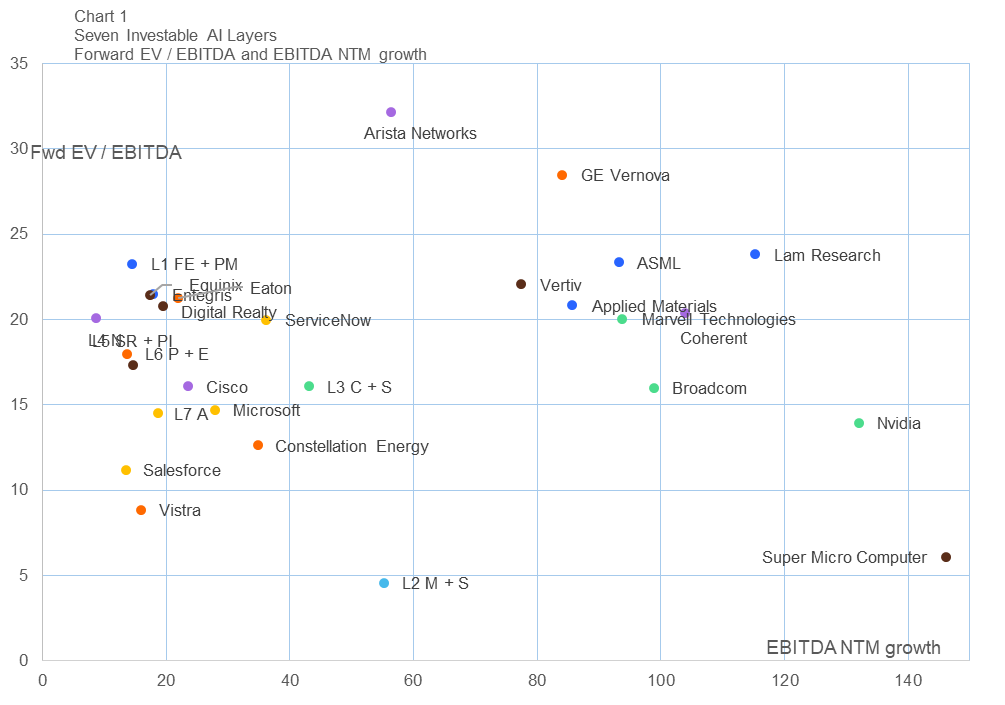
EV/EBITDA, used alongside FCF margins and EBITDA-margin trajectories, creates a separation between operating performance and accounting drag. The scatter plot of forward EV/EBITDA against forward EBITDA growth is more useful than a classic PEG ratio because it assesses the price investors are paying for the growth of an operating profit measure, which is more comparable across different business models.
Our framework is built to offset the limits mentioned above. EBITDA can overstate value in asset-heavy businesses if CapEx requirements remain persistently high, and EV/EBITDA can understate risk where working capital, lease obligations or maintenance CapEx absorb more cash than the headline multiple implies. That is precisely why it should not stand alone.
Signals from here
Our updated framework points to a more selective next phase. Fabrication, Memory and Networking continue to offer the strongest incremental evidence of physical AI demand. Networking and Site readiness, however, still carry execution risk because demand can exceed the pace of recognised revenue. Compute remains the sector’s epicentre, with AMD and Broadcom showing it stretching beyond a single company. Power is increasingly translating scarcity into contracted earnings. Applications are now credible enough to support the infrastructure narrative, although they do not yet resolve all concerns about ultimate RoIC.
Our main conclusion after Q2 is that the June framework has moved from thesis to operating evidence. The AI theme now presents stronger segment detail, clearer margin support and firmer proof of monetisation than it did in June. The threshold has also risen. The market is no longer paying simply for broad exposure to the buildout. It is rewarding companies that can convert demand into margins and FCF at a pace that supports their valuation.
Forward EPS growth, price performance and the scatter plot
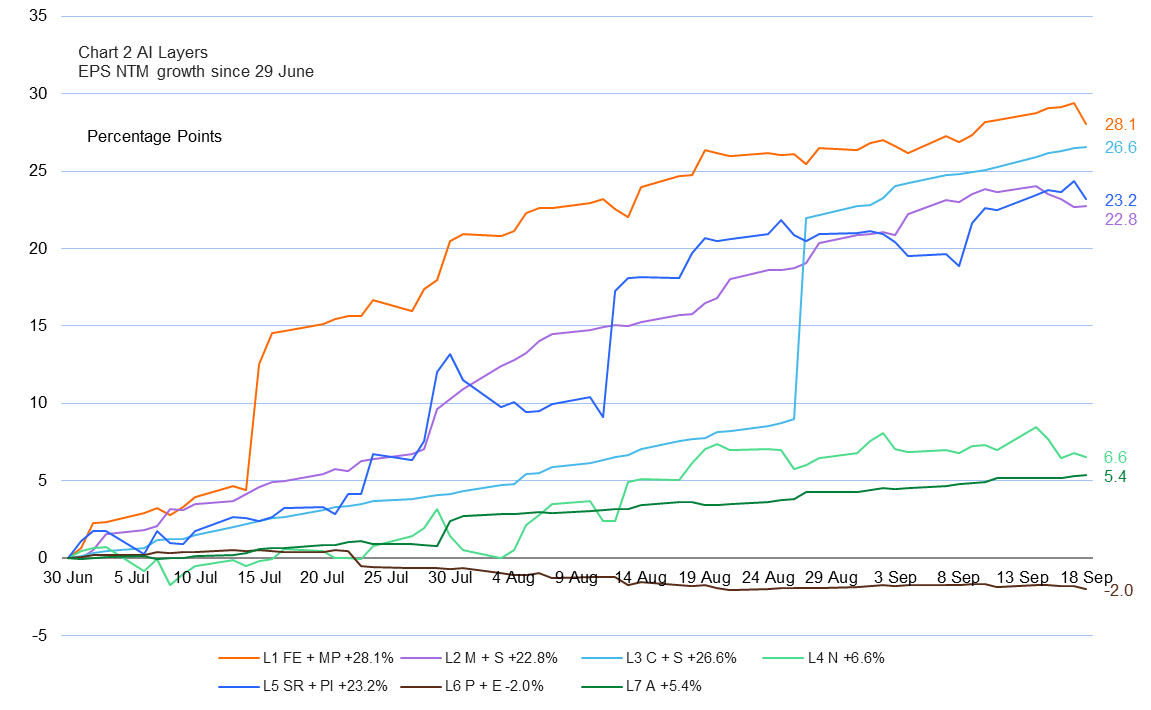
The most striking change is the inversion between earnings revisions (Chart 1) and price action (Chart 2) across the seven layers since 29 June. Fabrication Equipment & Process Materials posted the strongest forward EPS revision of the complex at 28.1 percentage points. This was followed by the season's sharpest move, Compute & Silicon at 26.6 points, up from single digits in late August as Nvidia and Broadcom lifted the layer's forward earnings. Site-readiness & Physical Infrastructure followed at 23.2 percentage points and Memory & Storage at 22.8 points. Networking and Applications drew far smaller marks. Power & Electrification was the sole layer revised lower, by 2.0 percentage points, as GE Vernova's backlog deceleration and Vistra's hedge accounting clouded an otherwise improving cash flow story.
Source: FactSet and EXANTE
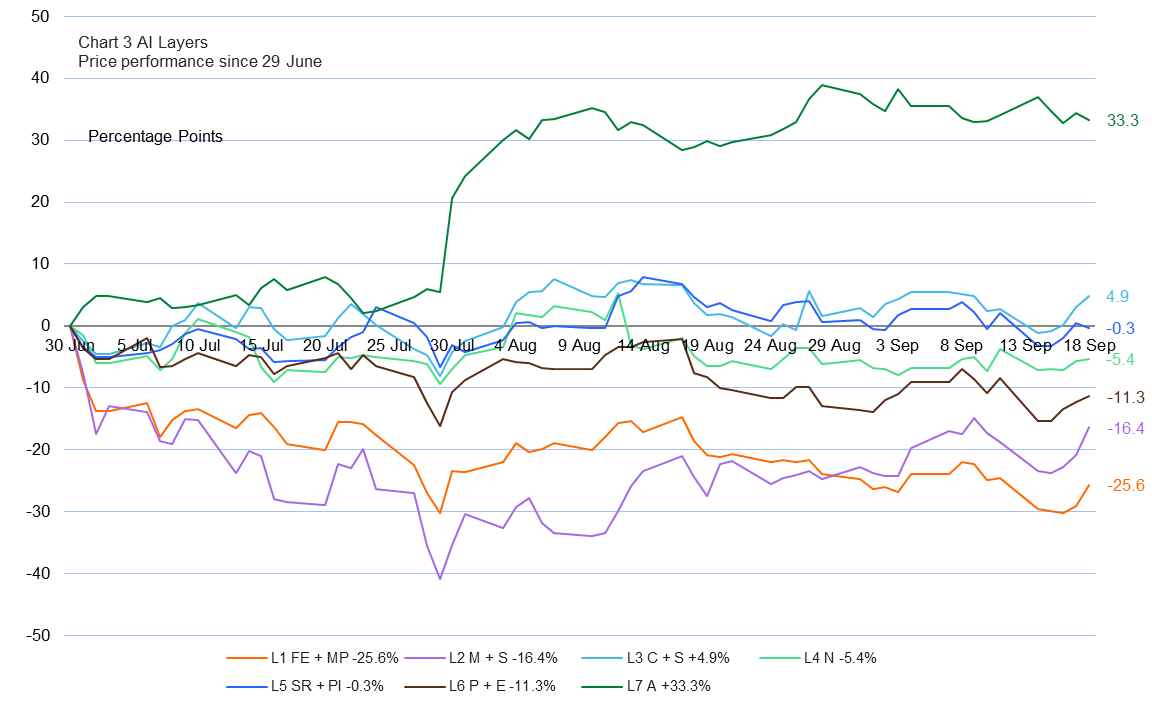
Price action tells a more selective story. Fabrication, with the strongest earnings revision of any layer, had the worst price performance, down 25.6% since 29 June. It is the cleanest example of a de-rating in which multiple compression has overwhelmed rising estimates.
Memory, down 16.4%, has recovered materially from its roughly 24% decline in late August. This suggests the market is beginning to re-rate the layer’s earnings rather than dismiss them as merely cyclical. Compute has turned positive, up 4.9%, its improvement dated squarely to Nvidia's print. Applications remain the standout, rising 33.3%. Site-readiness is down 0.3%, Networking is down 5.4% and Power is down 11.3%. Taken together, these figures show that the market has not disputed the direction of the earnings cycle, but it has compressed the valuation attached to it.
Applications show the clearest divergence in the opposite direction. A modest 5.4 percentage point EPS NTM revision produced the strongest price performance in the framework, with the layer up 33.3%. The move was driven largely by Microsoft’s ability to combine an Azure beat with lower CapEx guidance and 30 million paid Copilot seats. Compute & Silicon and Networking sit closer to the middle of the distribution on both measures. This is consistent with the view that both layers are still working through the gap between strong bookings and slower revenue recognition. Cisco’s $9.3 billion AI order book, compared with $4 billion of recognised AI revenue, provides the clearest example. Unlike our prior analysis, where the seven layer thesis remained largely a CapEx conviction story with limited earnings dispersion, we now see that the market has begun pricing conversion risk rather than thematic exposure, rewarding Applications while penalising the physically intensive layers, even where earnings evidence has been most supportive.
Networking remains caught between the two regimes. Its EPS NTM growth estimate is 6.6 percentage points above its 29 June level, while the basket is down 5.4%. That combination is consistent with strong underlying demand but slower recognition. Bookings, purchase commitments and optical-component constraints postpone the passage from order book to revenue.
Power & Electrification occupies the weakest quadrant, with a 2.0-point reduction in EPS NTM growth and an 11.3% price decline. The market is therefore distinguishing between long-duration scarcity and near-term earnings momentum. The structural power thesis remains intact, but the current estimate cycle has not yet converted that scarcity into broad-based upgrades.
The scatter of forward EV/EBITDA against EBITDA NTM growth (Chart 3) formalises the re-rating. Nvidia’s post-earnings revision moves Compute & Silicon toward the higher-growth portion of the distribution. Broadcom and Marvell preserve exposure to custom silicon and connectivity at different valuation points. The layer’s attraction has shifted from Nvidia to several business models now able to monetise the same compute expansion through merchant accelerators, ASIC design and high-speed interconnects. Nvidia commands the platform premium, but its forecast growth makes that premium more defensible than it appeared on 29 June.
Source: FactSet and EXANTE
Memory & Storage remains the most visible cluster offering strong growth at a reasonable multiple. Micron, SK Hynix and Sandisk sit closer to the high-growth, lower-multiple region than most application names. This reflects both extraordinary earnings momentum and the market’s refusal to capitalise memory earnings as permanently as software cash flows. That discount can be considered rational. Nevertheless, stronger WFE forecasts and continuing DRAM constraints indicate that the normalisation point has moved further out, increasing near-term asymmetry.
Within Networking, Arista and Coherent remain particularly informative. Both provide exposure to the increasing networking and optical content required per unit of accelerated compute, but they also illustrate why EBITDA growth must be considered alongside conversion risk.
In Fabrication, Applied Materials and Lam Research gain support from the upward WFE revisions. ASML retains the strongest structural moat, but carries a monopoly-quality multiple. The choice within L1 is between nearer-term earnings acceleration in deposition and etch, and the longer-duration scarcity value of lithography.
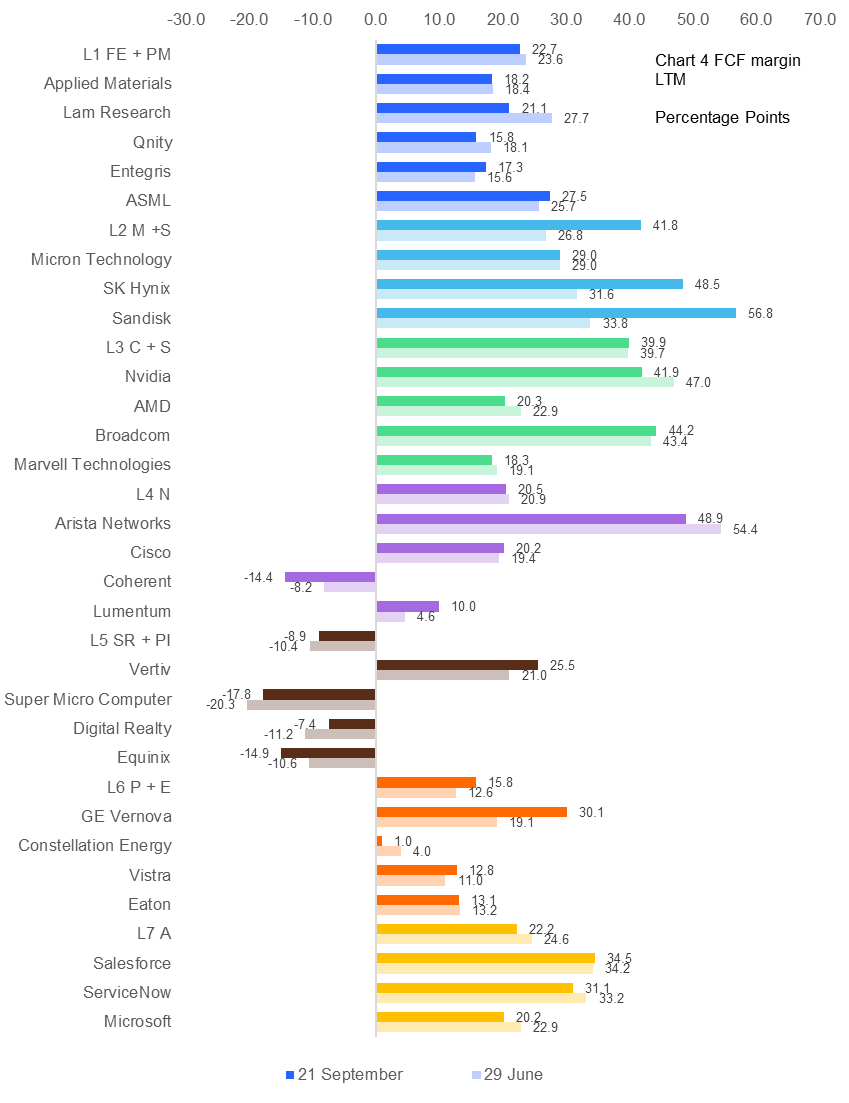
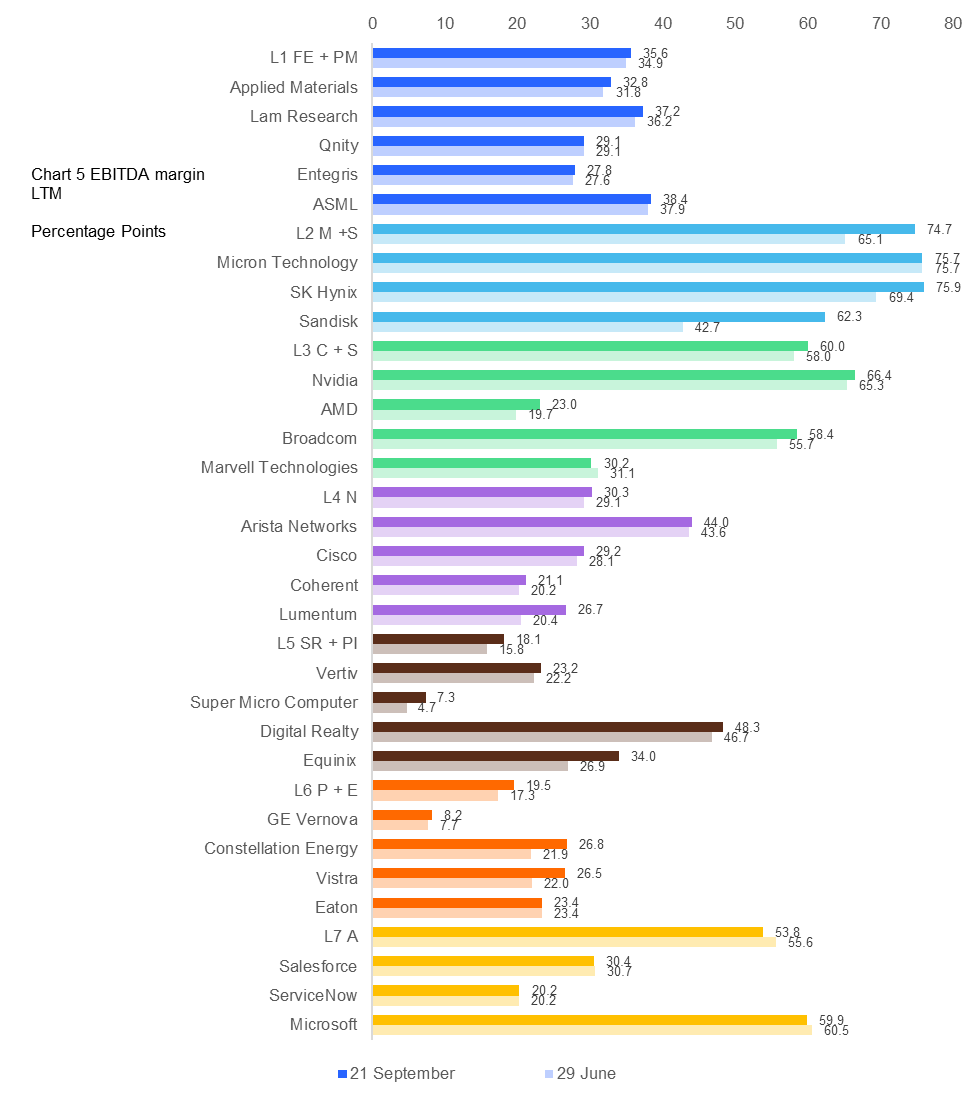
What is clear for investors is that the results from 29 June to now suggest two key features for further consideration. First, multiples have compressed broadly. In June the cloud extended toward 45x, with AMD and Marvell trading at 40x to 46x premiums. The richest name now sits near 32x and the custom-silicon premium has fallen back toward the high teens. Second, clustering within Memory and Compute has tightened even as horizontal growth expectations have held firm or risen. This is the crux of the matter: growth has been revised higher, while the multiples paid for it have been marked lower. Read alongside the FCF and EBITDA-margin exhibits (Charts 4 and 5, respectively) which show operating margins expanding broadly across the silicon-proximate layers, the de-rating reflects a repricing of equal or stronger fundamentals, not a deterioration in them.
Three conclusions matter.
First, the season marked the moment the buildout was re-underwritten on cash rather than conviction. With the discount rate elevated, investors have stopped rewarding the promise of return and begun pricing its arrival, so FCF conversion has become the vector that separates the layers.
Second, the sharpest dislocation is also the most instructive. Fabrication (L1) drew the strongest forward earnings revision in the complex, yet recorded the weakest price performance. This was a de-rating in which the multiple declined as fundamentals improved. In this case, the market is repricing risk, not disputing growth, and the mismatch between rising earnings estimates and falling multiples is often where the next cycle of returns begins.
Third, the AI taxonomy has earned its keep precisely because the layers have stopped moving as one block. Nvidia's print re-anchored Compute, Memory is convalescing from its summer de-rating, Power still awaits the estimate revisions that its contracted scarcity implies, and Applications are being paid for collecting the revenue the rest of the stack can only invoice. The dispersion is the opportunity. As for the industry's sudden appetite for restraint at the frontier, we would treat it as positioning rather than paradigm until a verification mechanism proves otherwise. The capital being committed across this framework has not read the memo.
Este artículo se presenta a modo informativo únicamente y no debe ser considerado una oferta ni solicitud de oferta para comprar ni vender inversión alguna ni los servicios relaciones a los que se pueda haber hecho referencia aquí. Operar con instrumentos financieros implica un riesgo significativo de pérdida y puede no ser adecuado para todos los inversores. Los resultados pasados no garantizan rendimientos futuros.




Regístrese para recibir perspectivas de los mercados
Regístrese
para recibir perspectivas
de los mercados
Suscríbase ahora Suscríbase ahora


Creado por profesionales. Para profesionales.
