

October Equity Review - Dispersion season


Executive summary
What happened in October
US Equities performance
European Equities Performance
Q3 earnings season so far
Q3 Revenue Growth
Q3 Earnings Growth
How is the market reacting to earnings relative to past seasons?
S&P 500 Net Profit margin: winners and losers
Earnings Forecasts for the coming quarters
Which sectors are sell-side analysts most bullish and bearish about now?
What to consider next

Horacio Coutino, Multi-asset Strategist
Executive summary
October revealed a growing mismatch between earnings momentum and the capital needed to sustain it. The S&P 500 declined 0.93%, but its equal-weight counterpart rose 4.90%, signalling rotation and not a wholesale retreat from risk. European equities also advanced, with defensive leadership masking pronounced sector dispersion.
Fundamentals remained resilient, with blended Q3 earnings growth reaching 30.2% on revenue growth of 13.4%, with all eleven S&P 500 sectors reporting y/o/y growth. Yet an aggregate surprise of only 1.9%, the slimmest since Q4 2022, and a forward P/E compressing from 19.1x to 18.5x, reveal a market that had already priced in the beat.
AI highlighted the gap between robust demand and shareholder returns. Faster cloud growth and larger backlogs strengthened demand visibility, but rising capital expenditure and weaker cash generation turned attention to financing, depreciation and incremental returns. Scarcity benefited selected suppliers while increasing costs for their customers, notably Apple and Intel.
Beyond technology, record industrial backlogs, commodity windfalls and resilient consumption required equally careful interpretation. Delivery capacity, capital allocation and household income increasingly determined the quality of growth. With Treasury yields near five percent, the next phase favours selectivity across investment cases where pricing, volumes, and balance-sheet velocity tell the same story.
This review provides:
- A summary of US & European markets October performance
- Q3 Earnings season to date
- Q3 Revenue Growth
- Q3 Earnings Growth
- A view on how the market reacted to earnings
- Q3 S&P 500 Net Profit Margin
- Earnings forecasts for the coming quarters
- A look at where analysts are most bullish and bearish
- What to consider next
What happened in October
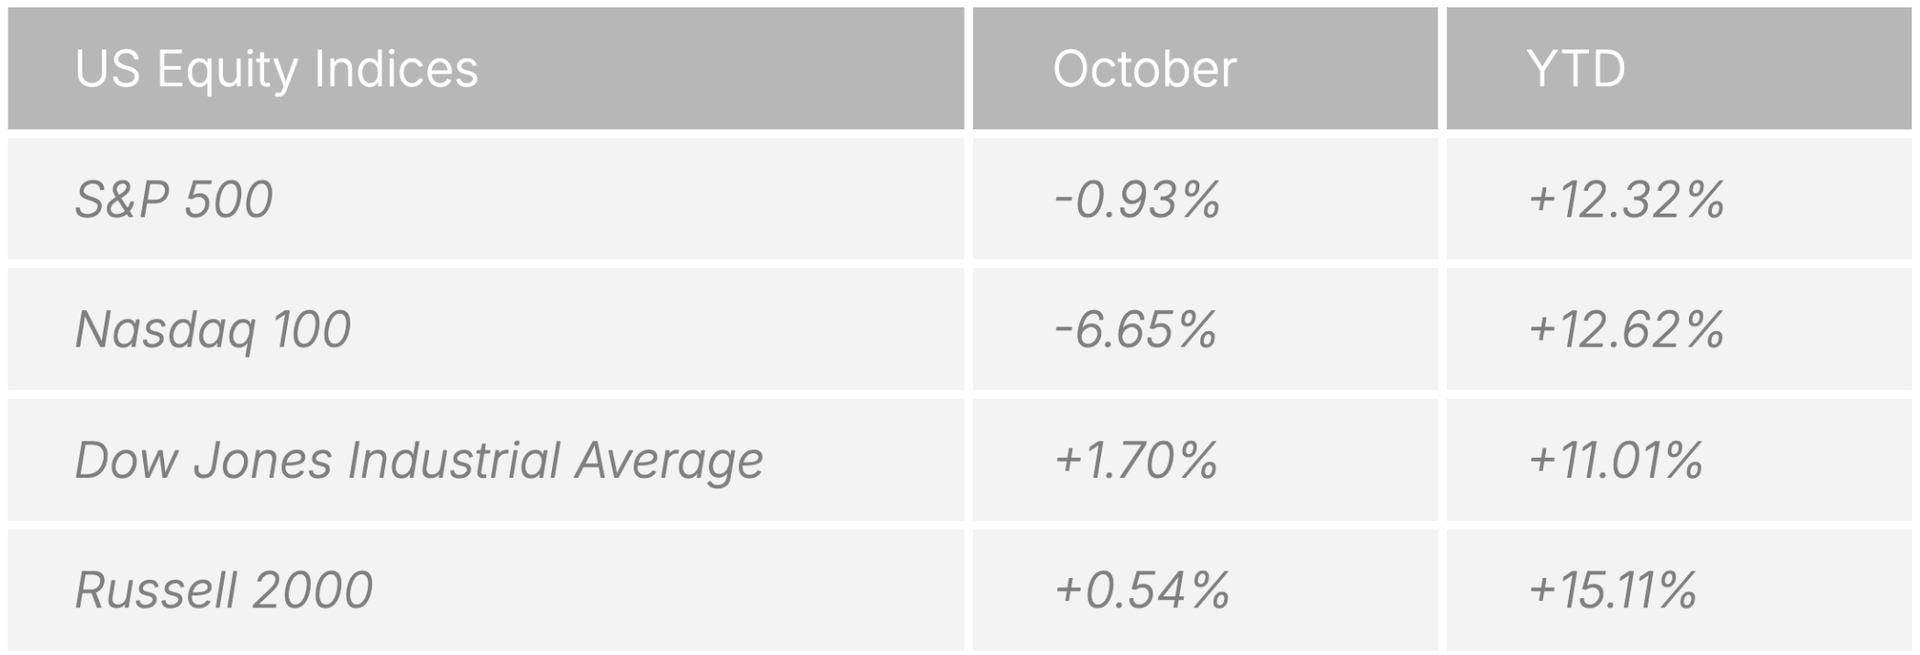
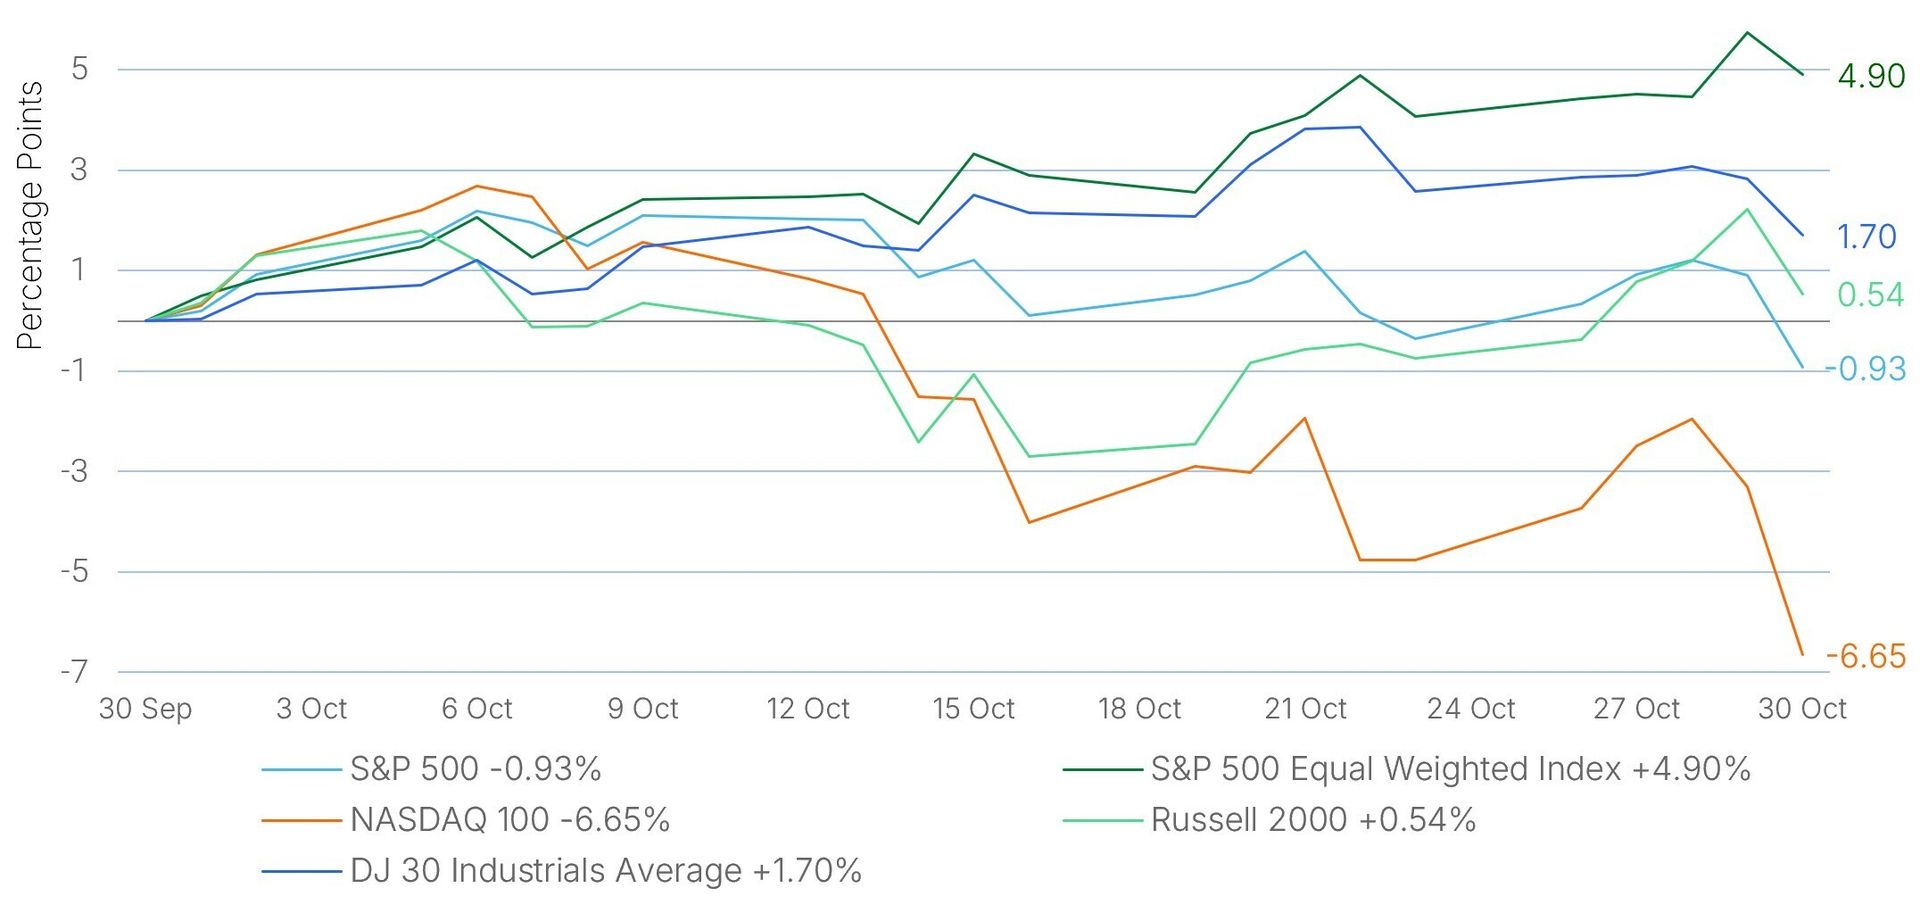
US equities delivered a mixed October after a broadly softer September. The S&P 500 posted a second consecutive monthly decline, yet its equal weight counterpart rose 4.90%, outpacing the cap weighted index by 583 bps and recouping most of September’s 4.99% loss. The Russell 2000 edged higher, while the Nasdaq lagged with its worst month since March 2025.
The AI debate shifted decisively from demand to financing. By mid-month, CoreWeave credit stress and Meta flagging hundreds of billions in potential capital needs fuelled funding anxieties. This sparked an eight session PHLX Semiconductor Index losing streak and steep memory and neocloud losses. However, subsequent major financing deals offered some relief. Azure, Google Cloud and AWS all beat the upper end of expectations with sharply higher backlogs, yet AI exposed shares closed markedly lower.
Instead of broader risk aversion, this technology pullback catalysed a sector rotation. Nearly 60% of S&P 500 constituents finished October above their 50-day moving averages versus roughly 21% in late September.
Q3 earnings remained solid, supported by resilient travel demand, improving industrial activity and sustained investment in AI infrastructure and electrification. Yet a demanding bar penalised several sound tech prints, while rising fuel, freight, commodity and memory costs pressured margins. Finally, a widening income division among consumers and persistent housing weakness tempered the US consumer picture.
US Equities performance
Source: FactSet and EXANTE. Data as of 5pm ET 4 November 2026.
A review of the past five years (60 months) reveals that the October performance across three of the four major US stock indices was subpar. Indices with greater exposure to Technology stocks, such as the Nasdaq Composite and Nasdaq 100, ended the month in negative territory. The Dow Jones Industrials Average performed best. Its 1.70% performance positioned it at its 50.8th percentile of the past 60-month performance distribution. It was the only major index to a performance above its median monthly performance.
The Russell 2000 advanced 0.54%, ranking it at the 47.4th percentile. The S&P 500’s loss of 0.93%, placed at its 30.5th percentile, with forty-two of the previous sixty months delivering stronger results. The Nasdaq 100 had the weakest performance, falling 6.65%. It ranked at the 10.1st percentile. This means that fifty-four of the past sixty months recorded a stronger performance.
US Equities (Chart 1)
Performance in October
Source: FactSet and EXANTE. Data as of 5pm ET 3 November 2026.
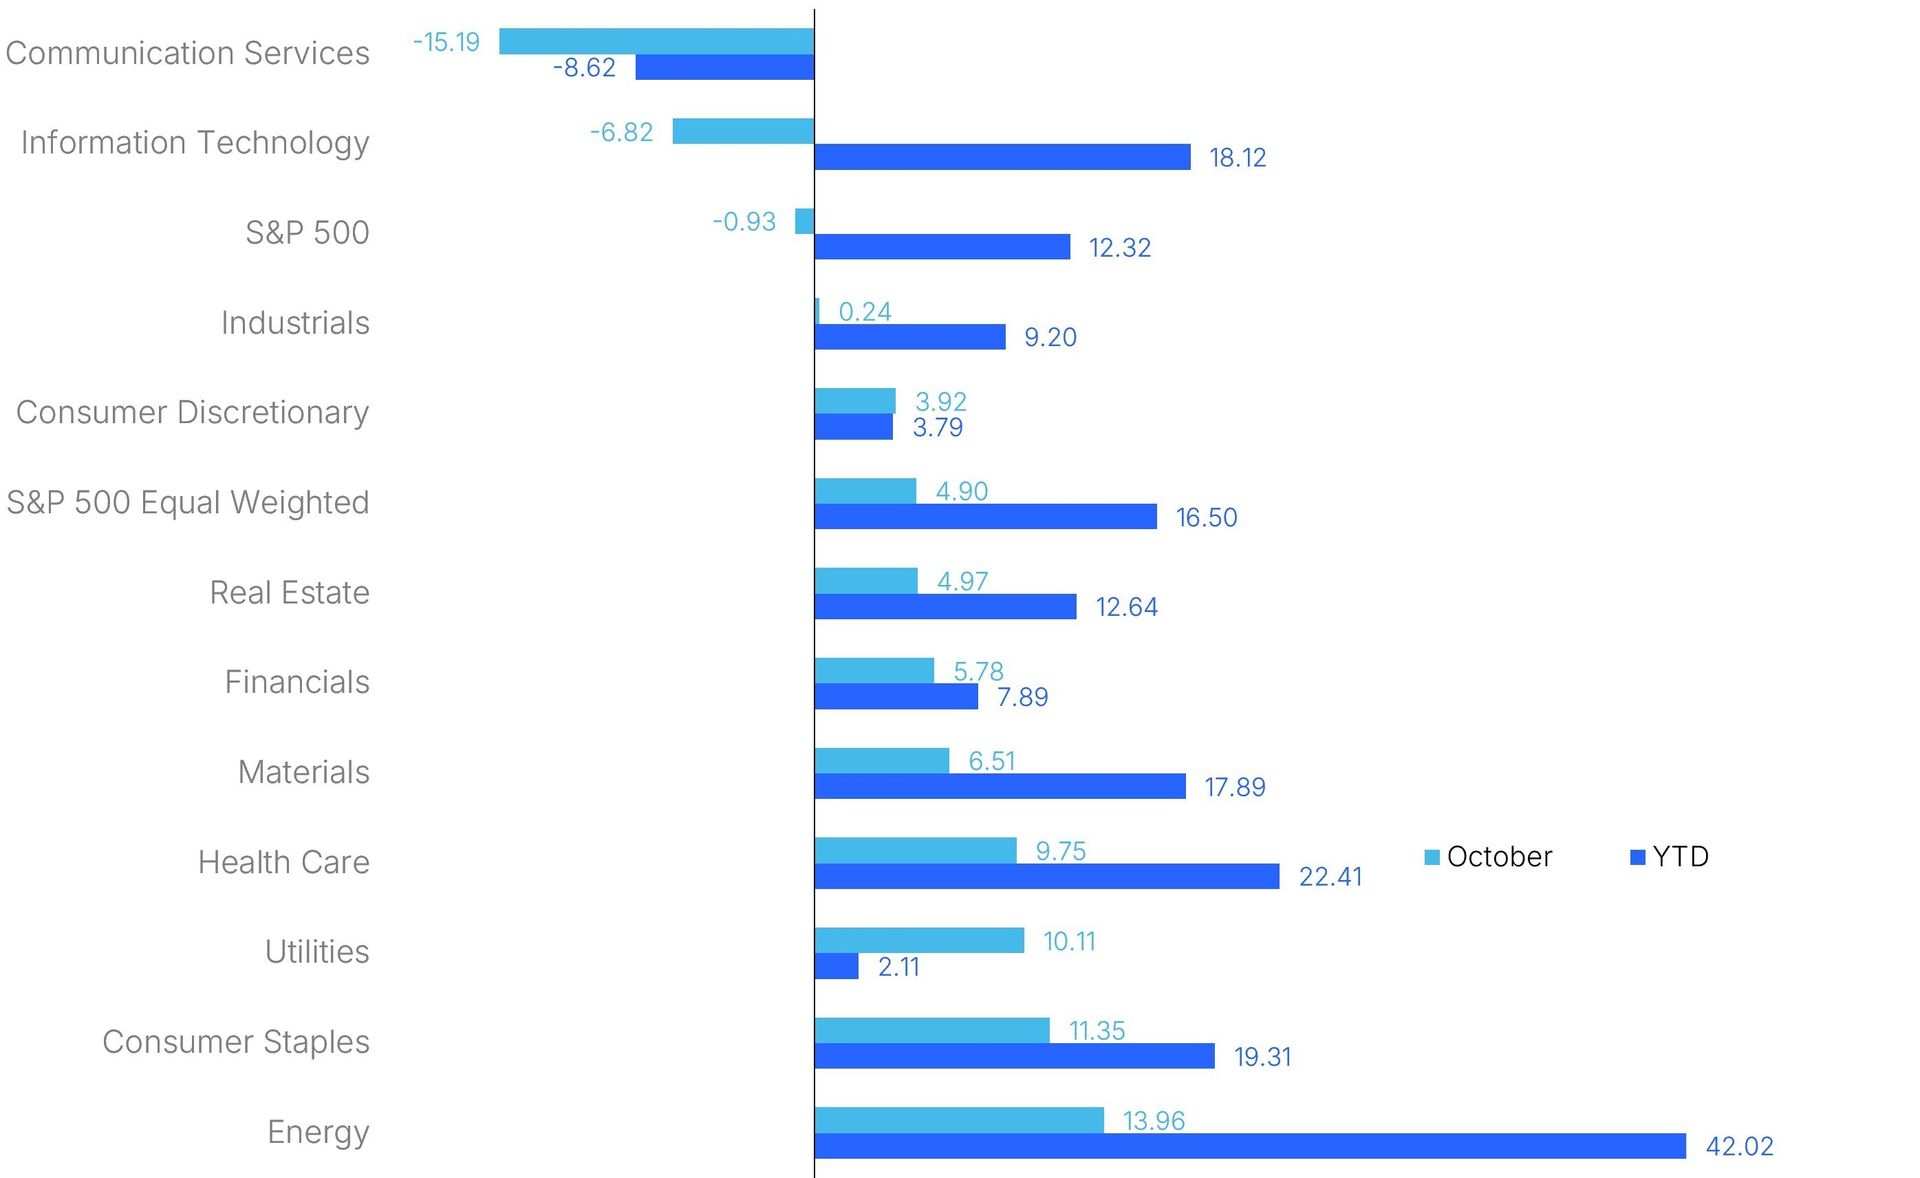
Nine of the eleven S&P 500 sectors advanced in October. The only two sectors that ended the month in negative territory are Communication Services with a decline of 15.19%, followed by Information Technology losing 6.82%. By contrast, Energy outperformed, advancing 13.96%, followed by Consumer Staples at 11.35% and Utilities at 10.11%.
S&P 500 (Chart 2)
Performance by sector in October (percentage points)
Source: FactSet and EXANTE. Data as of 5pm ET 4 November 2026.
European Equities Performance
Source: FactSet and EXANTE. Data as of 5pm ET 4 November 2026.
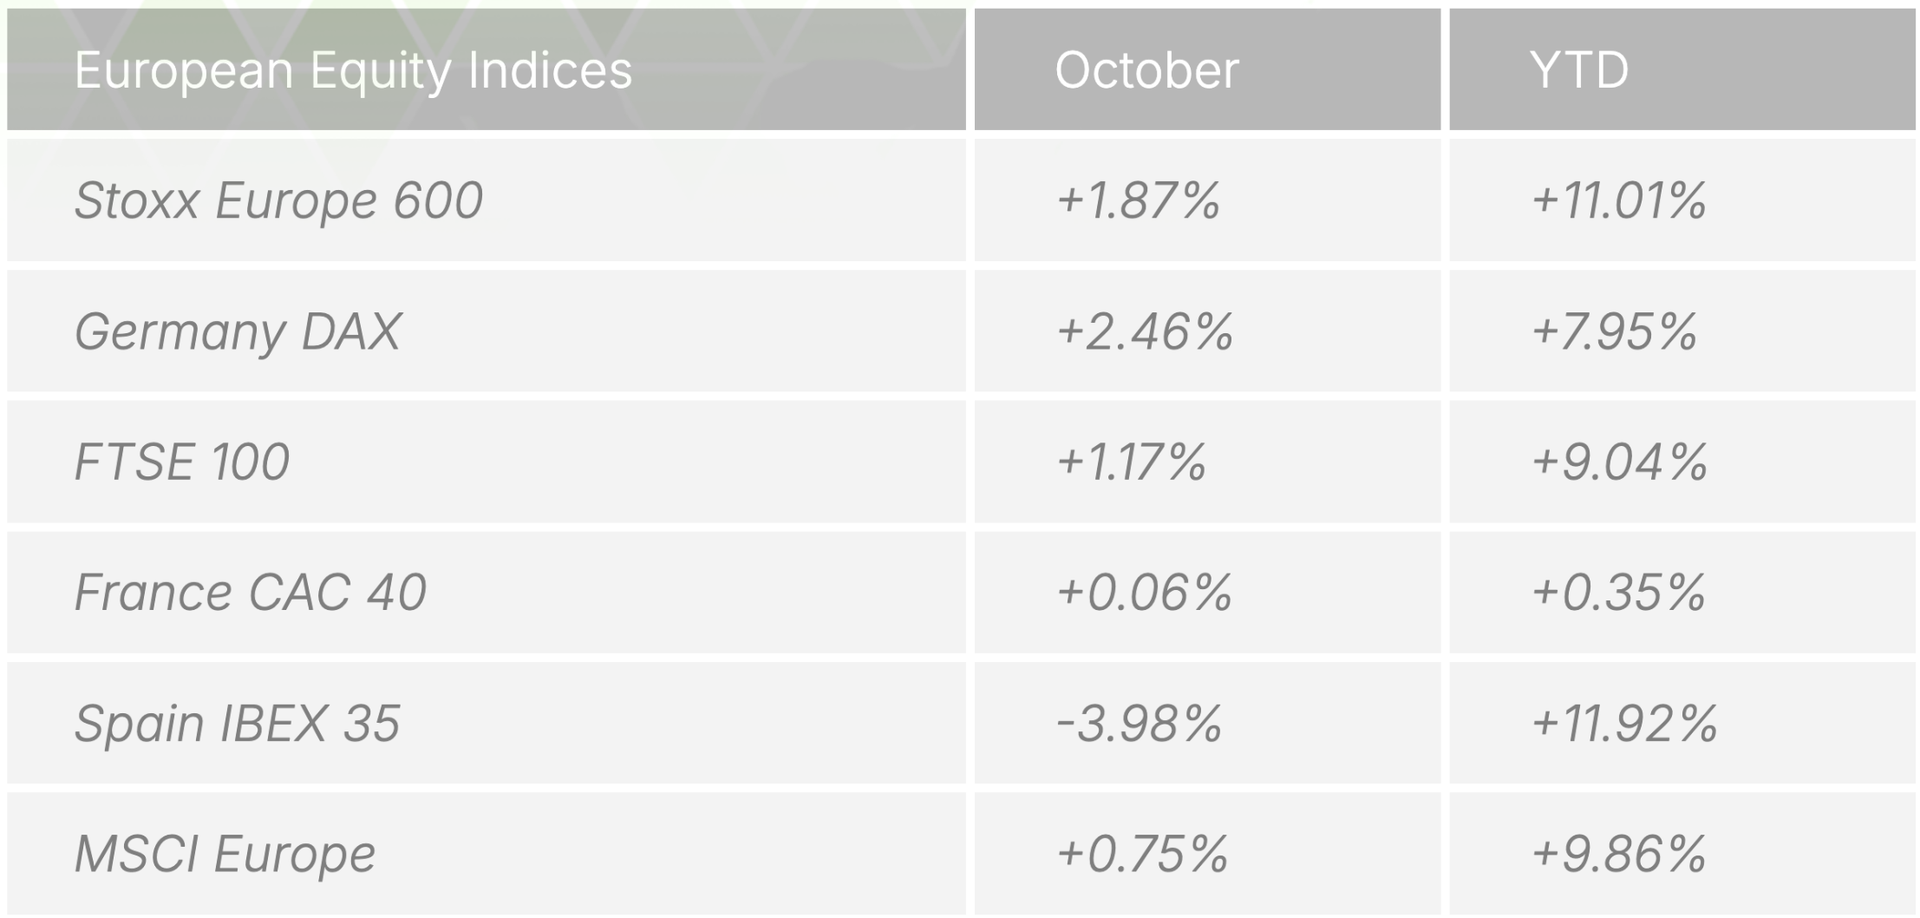
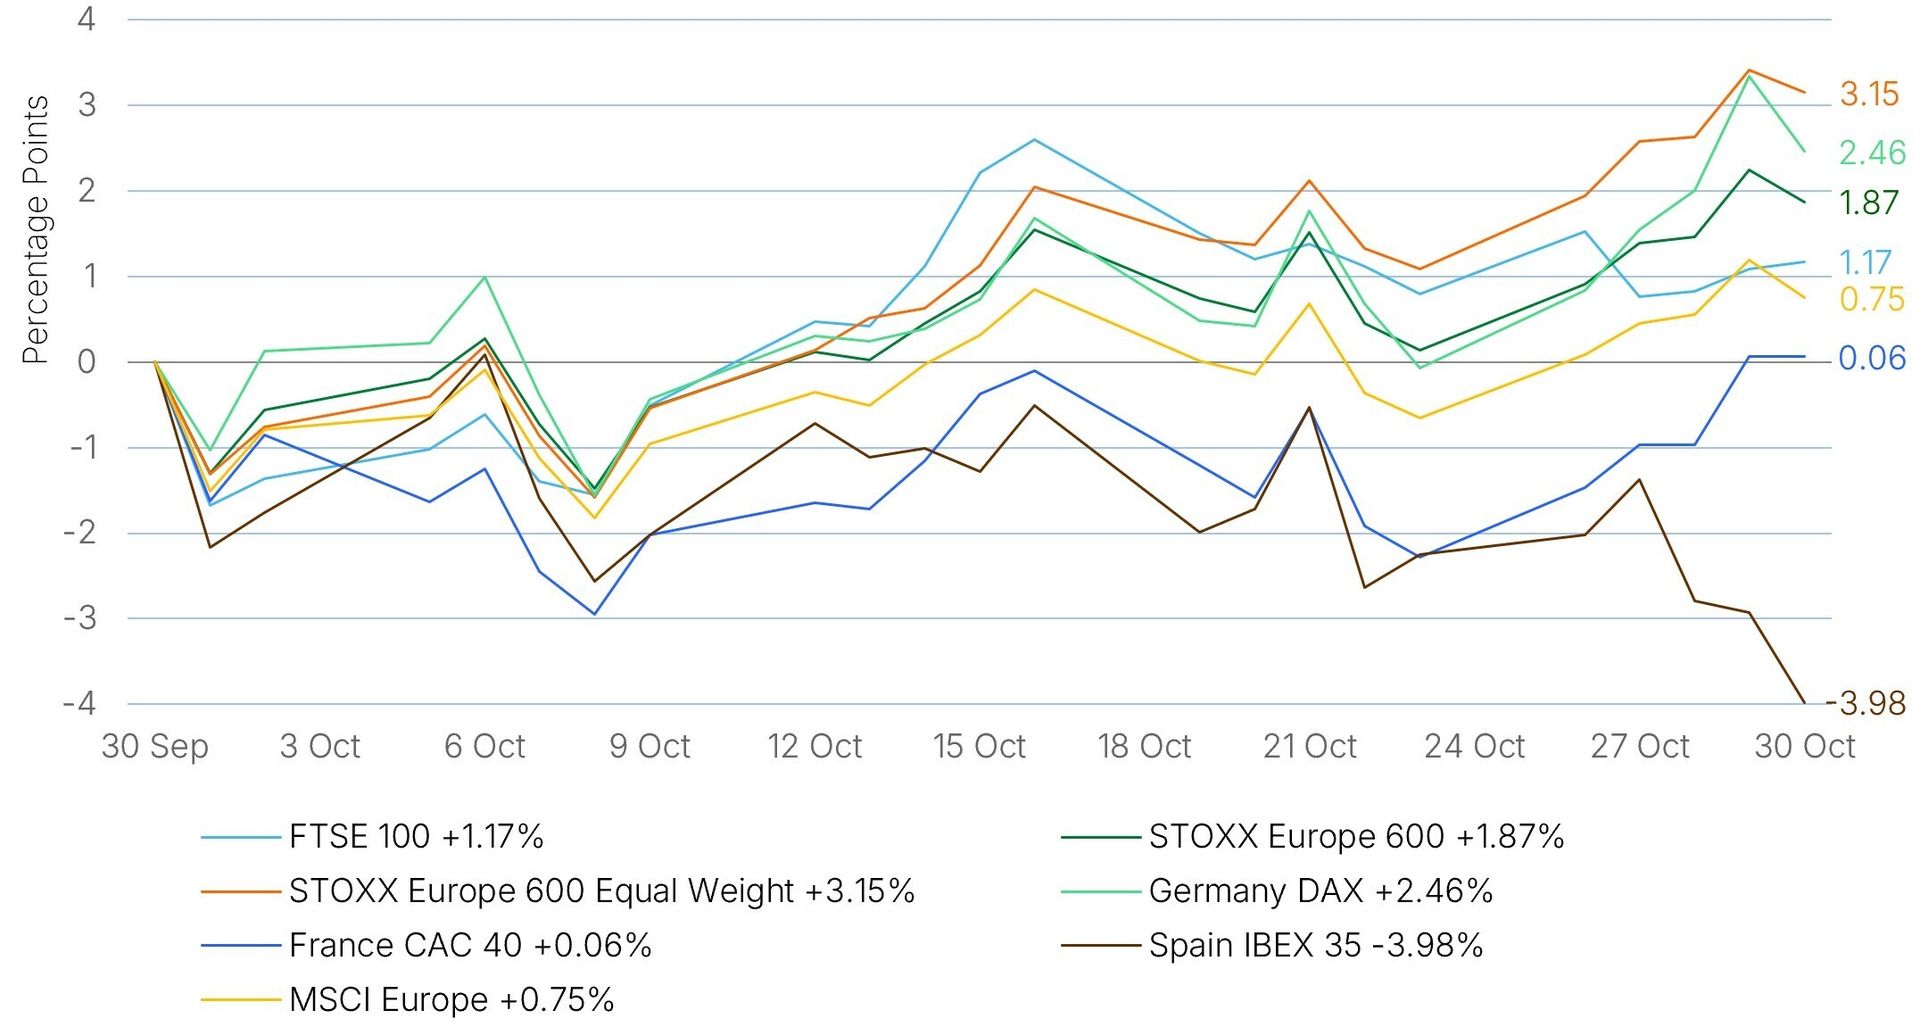
Despite divergence in the performance across individual countries, through October, four of the six major indices recorded monthly returns higher than the median performance of their respective 60-month distributions.
Spain IBEX 35’s 3.98% decline placed it at its 8.4th percentile, underperforming its European peers. Both MSCI Europe’s and France’s CAC 40 October performance positioned them at their respective 45.7th percentile of their five-year performance distribution. On an absolute basis, MSCI Europe’s 0.75% return was still better than France’s CAC 40 return of 0.06%. The UK’s FTSE 100 advanced 1.17%, placing it at 54.2nd percentile, indicating that twenty-seven months out of the past sixty produced stronger results. The Stoxx Europe 600 and Germany DAX rose in October, placing their returns at the 62.7th and 66.1st percentiles of their respective 60-month distributions. The DAX led with a 2.46% return.
European Equities (Chart 3)
Performance in October
Source: FactSet and EXANTE. Data as of 5pm ET 3 November 2026.
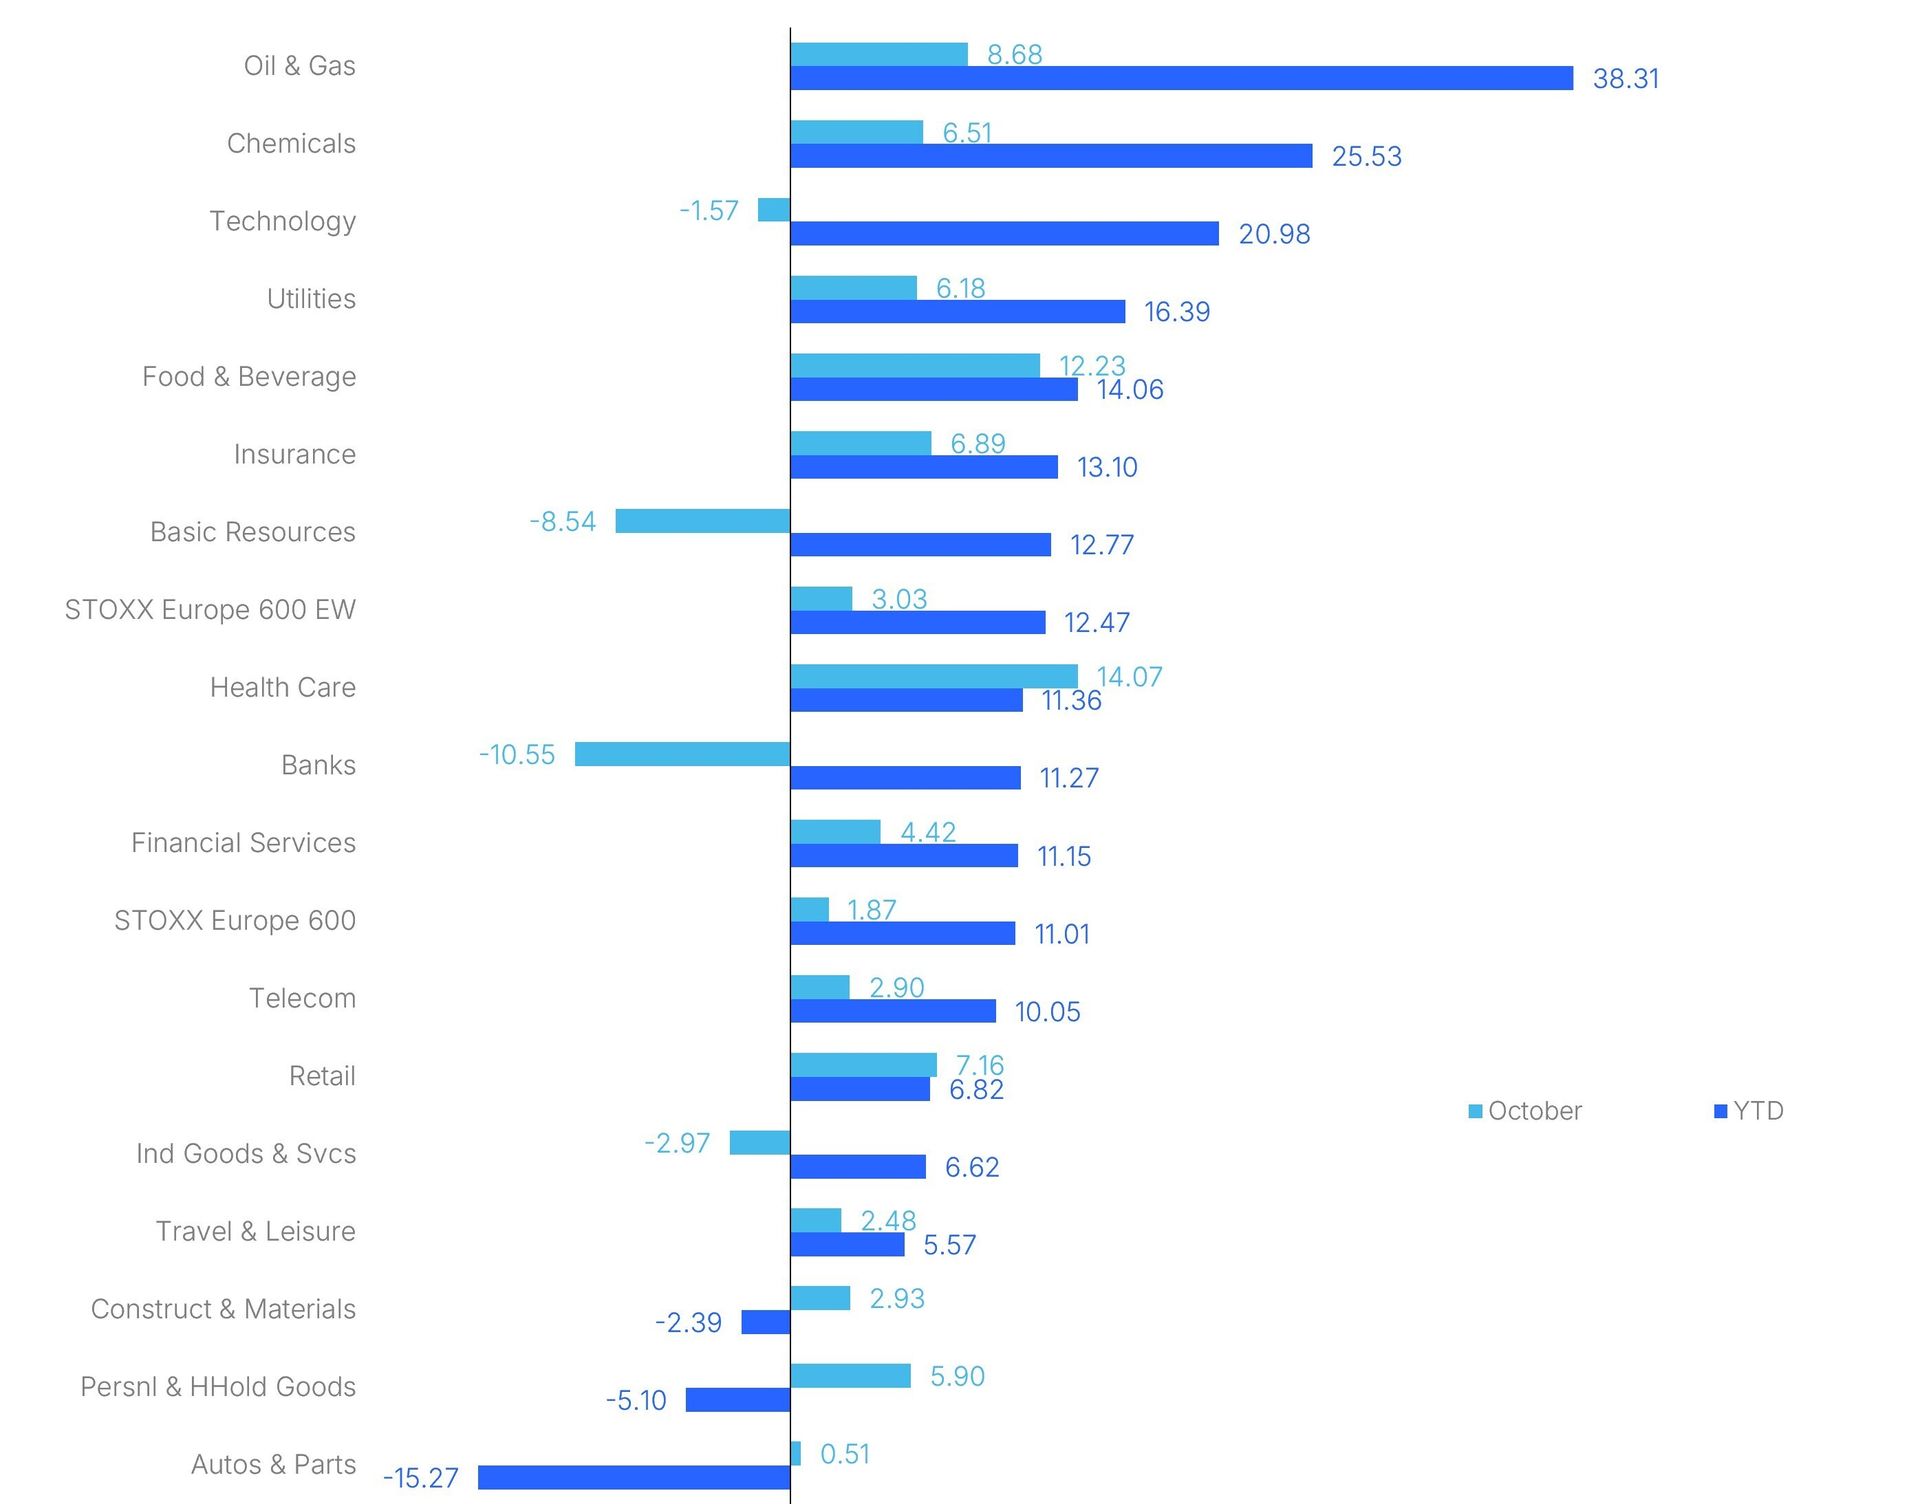
During the month of October, the Stoxx Europe 600 witnessed positive performance in thirteen out of its seventeen sectors. Health Care and Food & Beverages outperformed within the index, advancing 14.07% and 12.23%, respectively. In contrast, Banks recorded a decline of 10.55%, followed by Basic Resources and Industrial Goods & Services, down 8.54% and 2.97%, respectively.
Stoxx Europe 600 (Chart 4)
Performance by sector in October (percentage points)
Source: FactSet and EXANTE. Data as of 5pm ET 4 November 2026.
Q3 earnings season so far
As the earnings season progresses, 382 S&P 500 companies have reported at the time of writing, with mixed Q3 results relative to expectations. A larger-than-average share of companies has reported positive earnings surprises, but those surprises have been smaller than recent averages.
According to FactSet, as of 30 October, the blended earnings growth rate for Q3 is 30.2%, 0.7 percentage points higher than the 29.5% forecast last week and the 29.1% projected at the end of the quarter on 30 September. Should this figure hold, it will mark the eighth consecutive quarter of y/o/y double-digit earnings growth for the index and its third consecutive quarter of earnings growth above 25%. The index's net profit margin remains on track to exceed 15%. Yet equity performance did not fully reflect this strength. The S&P 500 ended October slightly lower, and its forward P/E multiple compressed from 19.1x to 18.5x during the month.
The magnitude of Q3 earnings exceeding expectations is below the five-year average of 7.5%. In aggregate, reported earnings are 1.9% above estimates. If sustained through the full reporting season, this would represent the lowest earnings surprise percentage reported by the index since Q4 2022, which was 1.3%.
Data compiled by LSEG I/B/E/S indicates that, as of 30 October, 59.4% of S&P 500 constituents had reported Q3 results. Of those reporting, 81.6% exceeded EPS estimates, slightly surpassing the prior four quarter average of 81.5%, the 5-year average of 78.0%, and the 10-year average of 77.0%.
Earnings growth has broadened substantially this season, signalling greater resilience than financial news headlines would suggest. At the end of Q3 (30 September), the estimated Q3 earnings growth for the Magnificent 7 (MAG 7) was 33.6%. So far, three of the six companies that have reported have beaten EPS estimates, compared with 81.6% of S&P 500 companies.
As of 30 October, MAG 7 earnings had missed estimates by 14.7% in aggregate, while S&P 500 earnings had exceeded estimates by 1.9%. These misses have reduced MAG 7’s blended Q3 earnings growth rate (which combines reported results with estimates for companies yet to report) to 22.6%, down from 33.6% at quarter-end. By contrast, blended Q3 earnings growth for the other 493 companies in the S&P 500 has risen to 32.6% from 27.8% during the same period.
However, extraordinary items and one-off events have distorted these EPS comparisons. Alphabet’s Q3 2026 EPS included an $8.7 billion loss in other income from net losses on equity securities. Amazon’s year-earlier Q3 2025 EPS included $9.5 billion in pre-tax, non-operating gains from investments in Anthropic. Meta Platforms’ Q3 EPS included a $9.9 billion charge related to a litigation agreement.
If these results persist through the end of the earnings season, MAG 7 will record lower earnings growth than the other 493 S&P 500 companies for the first time since Q4 2022. In that quarter, MAG 7 earnings declined by 30.6%, while earnings for the other companies increased by 1.6%.
On Monday, Apple reported Q3 EPS of $2.10, exceeding estimates by 5.6% and rising 13.6% y/o/y. This growth remained below the aggregate earnings growth of the rest of the S&P 500. Nvidia, the only MAG 7 company yet to report, is scheduled to release its results on 17 November, after the close.
Q3 Revenue Growth
The estimated y/o/y revenue growth rate for Q3 2026 is 13.4%. This is above the 5- and 10-year averages of 8.3% and 7.0%, respectively. Should the actual revenue growth rate for Q3 reach 13.4%, it would be the third consecutive quarter of double-digit growth for the index.
Blended Q3 2026 revenue growth is 13.4% y/o/y, up from the 12.2% estimate on 30 September. Upward estimate revisions and positive revenue surprises have improved revenue growth or narrowed declines in eight sectors since quarter-end.
Energy led the improvement, with revenue growth rising from 21.9% to 28.5%, followed by Health Care, where growth rose from 4.0% to 5.3%, and Information Technology, where it increased from 39.9% to 41.9%.
Q3 Earnings Growth
The projected y/o/y earnings growth rate for Q3 is 30.2%. This figure is above the 5-year average of 13.3% and the 10-year average of 12.6%. Sector-specific analysis reveals that all eleven sectors within the S&P 500 are reporting y/o/y earnings growth, led by Energy, Information Technology, Materials and Communication Services. Seven of eleven sectors are reporting double-digit growth.
Energy is expected to report the highest y/o/y earnings growth rate of all eleven sectors at 146.4%. At the sub-industry level, four of the five sub-industries in the sector are projected to report y/o/y earnings growth. The Oil & Gas Refining & Marketing industry is expected to be the largest contributor to earnings growth for the sector, growing 536.0% y/o/y. On the other hand, the Oil & Gas Equipment & Services sub-industry is the only sub-industry in the sector reporting a y/o/y decline in earnings. At the company level, ONEOK delivered the most pronounced upside surprise, reporting EPS of $2.13 versus an estimate of $1.50. Additionally, ExxonMobil, which reported EPS of $4.23 compared with an expected $4.12, Valero Energy’s EPS of $23.90 against expectations of $21.17 and Phillips 66’s EPS of $14.08 surpassing the $11.73 estimate, have been significant contributors to the increase in the earnings growth rate for the sector since 30 September. Energy earnings have exceeded estimates by 8.8% in aggregate so far, helping lift the sector’s blended earnings growth rate by 31.6 percentage points since quarter-end, from 114.8% to 146.4%.
Information Technology is forecast to deliver the second-highest y/o/y earnings growth, with an increase of 67.5%. At the industry level, all six constituent industries are anticipated to achieve earnings growth, and four of these industries are expected to achieve double-digit growth. Within the sector, positive EPS surprises from Micron Technology, Microsoft and Intel have contributed substantially to the index’s earnings growth improvement since 30 September. Micron reported EPS of $33.42 exceeded the estimate of $31.77, Microsoft delivered $4.89 versus $4.72 expected and Intel posted $0.52 against expectations of $0.41. Information Technology’s positive EPS surprise of 5.2% has helped lift the sector’s blended earnings growth rate by 3.7 percentage points, from 63.8% on 30 September to 67.5% currently.
Materials reports the third-highest y/o/y earnings growth rate among the eleven sectors, with a 30.6% increase. Three of the sector’s four industries are reporting double-digits annual earnings growth, led by Metals & Mining, while Construction Materials is reporting a decline. Materials’ blended Q3 earnings growth rate has risen by 2.1 percentage points, from 28.5% on 30 September to 30.6%, supported in part by the sector’s EPS surprise factor of 2.9%.
Communication Services is projected to report earnings growth of 20.5% y/o/y. However, EPS shortfalls at Alphabet and Meta Platforms have been the largest detractors from the index’s earnings growth improvement since 30 September. Alphabet reported EPS of $2.12 against an estimate of $3.02, while Meta Platforms reported $3.83 compared with an expected $6.54. These misses have reduced the sector’s blended earnings growth rate from 51.5% to 20.5% over this period. Communication Services is the only sector reporting a negative EPS surprise, with earnings 21.5% below estimates so far.
Health Care has recorded the largest positive earnings surprise, exceeding estimates by 13.2%. EPS surprises from Eli Lilly, Merck, Bristol Myers Squibb, Gilead Sciences and Regeneron Pharmaceuticals have contributed substantially to the sector’s earnings growth improvement. Eli Lilly reported EPS of $7.48 against an estimate of $5.71 and Merck delivered $2.49 compared with an expected $2.09. Bristol Myers Squibb posted $1.35 against a forecast of $1.10, Gilead Sciences earned $2.55 compared with $2.19 expected and Regeneron Pharmaceuticals reported $20.07 against an estimate of $16.42. The index’s earnings growth rate has improved to 5.2% from a projected decline of 1.2% the previous week.
As of 29 October, according to LSEG I/B/E/S data for the Stoxx 600, Q3 2026 earnings are expected to increase 23.6% from Q3 2025. Excluding the Energy sector, earnings are expected to increase 9.8%. Q3 2026 revenue is expected to increase 13.6% from Q3 2025. Excluding the Energy sector, revenues are expected to increase 6.2%.
The Stoxx 600 expects to see share-weighted earnings of €162.6 billion in Q3 2026 compared to share-weighted earnings of €131.5 billion (based on the year-ago earnings of the current constituents) in Q3 2025.
Eight of the ten sectors in the index expect improved earnings compared to Q3 2025. At 139.0%, Energy has the highest earnings growth rate for the quarter, while Real Estate has the highest anticipated contraction of 69.0% compared to Q3 2025.
The forward four-quarter price-to-earnings ratio (P/E) for the Stoxx 600 sits at 13.9x. This is below its 10-year average of 14.2x.
Analysts anticipate positive Q3 earnings growth in fifteen of the sixteen Stoxx 600 index jurisdictions. Norway, with an estimated growth rate of 83.6%, and Portugal, at 83.5%, are projected to have the highest earnings growth, followed by Poland at 79.5% and the Netherlands at 68.3%. Ireland is expected to experience a decline in earnings of 7.1%, followed by Germany, with an earnings contraction of 3.4%.
How is the market reacting to earnings relative to past seasons?
Companies reporting positive Q3 2026 earnings surprises saw their share prices rise by an average of 1.6% from two days before to two days after the earnings release, exceeding the five-year average gain of 0.9% for positive surprises over the same window.
Conversely, companies reporting negative Q3 2026 earnings surprises saw their share prices fall by an average of 2.1% over the same window, from two days before to two days after the earnings release. This decline was smaller than the five-year average fall of 3.1% for negative surprises.
S&P 500 Net Profit margin: winners and losers
The Q3 projected net profit margin for the S&P 500 stands at 14.9%. This is below Q2’s net profit margin of 17.0%, which is the current record going back to 2009, but is above both the year-ago net profit of 13.0% and the five-year average of 12.6%.
At the sector level, seven sectors are forecast to achieve a y/o/y increase in net profit margins compared to the same period in 2025. Information Technology is expected to lead this growth, followed by Energy. Conversely, three sectors are anticipated to experience a y/o/y decline in net profit margins, with Financials and Consumer Discretionary showing the most pronounced decrease. Health Care is reporting no y/o/y change in net profit margin.
Furthermore, eight sectors are forecast to report net profit margins in Q3 that exceed their respective five-year averages. Information Technology is expected to show the most significant improvement, attaining 32.4% compared to a five-year average of 25.9%. In contrast, three sectors are forecast to report net profit margins below their five-year averages, led by Communication Services, which is expected to post a margin of 11.3%, lower than its five-year average of 13.7%.
Earnings Forecasts for the coming quarters
Looking ahead, analysts are forecasting y/o/y earnings growth rates of 28.4%, 19.2% and 2.8% for Q4 2026, Q1 2027 and Q2 2027, respectively. For the entirety of calendar year 2026, analysts are anticipating a y/o/y earnings growth of 32.9%.
As of 30 October, the bottom-up target price over the next 12 months for the S&P 500 is set at 9,327.80. This is a 23.1% increase over October’s closing price of 7,580.07.
Based on the difference between bottom-up target prices and closing prices, the sectors with the most significant anticipated price appreciation are Communication Services at 38.5%, Information Technology at 27.9% and Consumer Discretionary at 22.9%. In comparison, the smallest expected price increases are forecast for Health Care, expected to increase by 5.3%. This is followed by Energy, expected to have a 6.0% rise, and Consumer Staples, anticipated to advance 7.4%.
Which sectors are sell-side analysts most bullish and bearish about now?
According to FactSet, as of 30 October, there are currently 13,324 analyst ratings on S&P 500 constituents. Of these, 59.9% are designated as Buy ratings, 35.3% as Hold and 4.8% as Sell. This represents the highest proportion of Buy ratings at month-end since at least 2010.
Analysts are most positive on Communication Services, Information Technology and Energy, with Buy ratings accounting for 73%, 69% and 63% of each sector’s total ratings, respectively.
Conversely, analysts are least optimistic regarding Consumer Staples, Utilities and Financials. They assigned Buy ratings to just 48%, 53%, and 55% of these sectors, respectively. Consumer Staples carries the highest proportion of Hold ratings at 45%, as well as the largest share of Sell ratings at 7%. Financials and Consumer Discretionary follow, both with 6% of their ratings as Sell.
What to consider next
If this earnings season has delivered a single lesson, it is that growth is no longer the scarce commodity. Blended Q3 earnings growth of 30.2% would ordinarily invite celebration, yet an aggregate surprise of 1.9%, the slimmest since Q4 2022, alongside a compressing forward multiple suggests that beating consensus became less persuasive without credible guidance and cash conversion.
AI has made that tension explicit. Over four weeks of results, the market drew a clean line between companies that sell scarce capacity and those obliged to own it. Upstream, Vertiv, GE Vernova, Sandisk and Seagate turned contracted demand, customer prepayments and output allocated through 2028 into extraordinary operating leverage. Downstream, Alphabet and Amazon reported accelerating cloud growth and backlogs above half a trillion dollars, only to be punished because the physical cost of fulfilling that demand has outrun internal cash generation. A compelling order book can still produce an unappealing cash flow statement. As the capital cycle grows more fragile and 10-year US Treasury yields hover near five percent, equity investors’ patience for unbridled CapEx and distant optionality has officially expired.
Investors should also resist mistaking technology intensity for economic breadth. More fibre, cooling, storage and power per rack flatters a narrow set of suppliers whose fortunes rest on a handful of correlated hyperscaler budgets. Intel’s PC warning and Apple’s hardware price increases show that, further down the chain, the same scarcity arrives as cost inflation.
Beyond AI, the binding constraint has migrated from demand to delivery. Record defence and aerospace backlogs, Boeing’s included, now matter less than the factory floor’s ability to convert them into margin. Commodity producers face a parallel test, as war driven refining spreads and copper scarcity reward capital discipline rather than ambition.
Banks first highlighted the difference between stronger activity and broader growth. Equity financing and wealth inflows offered clearer signals than the broader M&A recovery, while asset repricing bolstered net interest income. Deposit costs, wholesale provisions and underwriting standards deserve attention, since higher yields reward lenders before testing borrowers.
Finally, the consumer remains divided by income, as Amazon’s muted holiday outlook attests, and housing offers little relief. Eli Lilly’s volume led growth provided the season’s instructive counterpoint. The most resilient investment cases will likely be those in which pricing, volumes and cash flow tell the same story.
DISCLAIMER: This article is provided to you for informational purposes only and should not be regarded as an offer or solicitation of an offer to buy or sell any investments or related services that may be referenced here. Past performance and forecasts are not reliable indicators of future results.
While every effort has been made to verify the accuracy of this information, EXT Ltd. (hereafter known as "EXANTE") cannot accept any responsibility or liability for reliance by any person on this publication or any of the information, opinions, or conclusions contained in this publication. The findings and views expressed in this publication do not necessarily reflect the views of EXANTE. Any action taken upon the information contained in this publication is strictly at your own risk. EXANTE will not be liable for any loss or damage in connection with this publication.
Este artículo se presenta a modo informativo únicamente y no debe ser considerado una oferta ni solicitud de oferta para comprar ni vender inversión alguna ni los servicios relaciones a los que se pueda haber hecho referencia aquí. Operar con instrumentos financieros implica un riesgo significativo de pérdida y puede no ser adecuado para todos los inversores. Los resultados pasados no garantizan rendimientos futuros.
 Volver a todas las perspectivas




Regístrese para recibir perspectivas de los mercados
Regístrese
para recibir perspectivas
de los mercados
Suscríbase ahora Suscríbase ahora



Creado por profesionales. Para profesionales.
