
Low-fire, low-hire, high-wire?

Corporate Earnings Calendar
Thursday: Airbnb, Applied Materials, Arista Networks, Coinbase, Expedia, Kimco Realty, Vertex Pharmaceuticals, Wynn Resorts
Friday: Moderna
Tuesday: Allegion, Devon Energy, EQT, FirstEnergy, Kenvue, Medtronic, Palo Alto Networks, Vulcan Materials
Wednesday: American Water Works, Booking Holdings, Carvana, CF Industries, DoorDash, Molson Coors Beverage, Moody’s, Occidental Petroleum, Texas Pacific Land
Global market indices
US Stock Indices Price Performance
Nasdaq 100 -1.37% MTD and -0.19% YTD
Dow Jones Industrial Average +2.51% MTD and +4.28% YTD
NYSE +3.35% MTD and +6.71% YTD
S&P 500 +0.04% MTD and +1.40% YTD
The S&P 500 is +0.85% over the past seven days, with 7 of the 11 sectors up MTD. The Equally Weighted version of the S&P 500 is +1.58% over this past week and +6.14% YTD.
The S&P 500 Energy is the leading sector so far this month, +7.84% YTD, while Communication Services is the weakest sector at -5.66% YTD.
Over the past seven days, Energy outperformed within the S&P 500 at +4.18%, followed by Information Technology and Real Estate at +3.55% and +3.50%, respectively. Conversely, Consumer Discretionary underperformed at -3.66%, followed by Communication Services and Financials at -3.13% and -2.29%, respectively.
The equal-weight version of the S&P 500 was +0.23% on Wednesday, outperforming its cap-weighted counterpart by 0.23 percentage points.
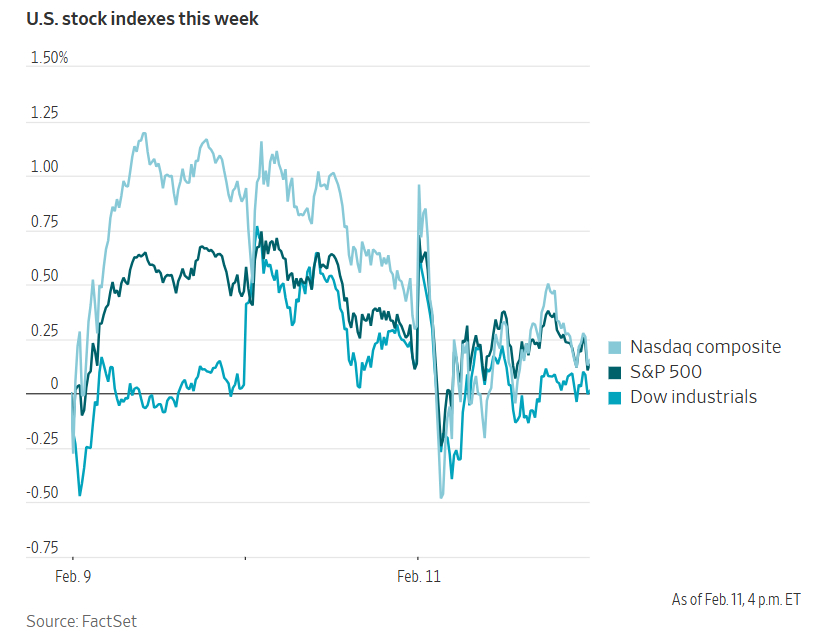
On Wednesday the S&P 500 was flat at 6,941.47, while the Dow Jones Industrial Average -0.13%, or 66.70 points. The Nasdaq Composite Index was -0.13%.
Over the past seven days, the S&P 500 is +0.85%, the Dow Jones +1.25%, and the Nasdaq Composite +0.71%.
In corporate news, the Trump administration has issued a general licence permitting US oilfield-services companies to operate in Venezuela.
The US Food and Drug Administration declined to review Moderna’s application for its new seasonal influenza vaccine.
QXO has entered into an agreement to acquire Kodiak Building Partners, a privately held company, for approximately $2.25 billion. QXO anticipates that this transaction will enhance its earnings for 2026.
Elliott Investment Management, an activist investor, has taken a position in the London Stock Exchange Group.
Meta Platforms has announced plans to invest over $10 billion in the construction of a data centre campus in Lebanon, Indiana, marking one of the company’s largest infrastructure commitments to AI to date.
Pershing Square, led by Bill Ackman, has disclosed a substantial investment in Meta Platforms. The stake represents approximately 10% of the capital managed by Pershing Square as of year-end, according to an investor presentation on Wednesday. The position was established in late November.
Private equity firms Thoma Bravo and Vista Equity Partners are actively seeking to reassure their fund investors regarding the health of their portfolios, following concerns over potential disruptions caused by AI that triggered a broad sell-off in equities last week.
Kraft Heinz has unexpectedly abandoned its plans to split the company into two entities, just weeks after appointing a new chief executive officer with previous experience in corporate separations within the food industry.
Ancora Holdings Group, an activist investor, is urging the board of Warner Bros. Discovery to reject an offer from Netflix and reconsider a rival bid from Paramount Skydance, introducing a new development in one of Hollywood’s most significant takeover contests.
Baker Hughes is reportedly exploring the potential sale of its Waygate Technologies division, which specialises in industrial testing and inspection equipment, according to individuals familiar with the matter.
Bonus payments at Lululemon Athletica are currently trending below target for this year, as indicated by a recording of an internal meeting reviewed by Bloomberg news.
Mega caps: The Magnificent Seven had a mixed performance over the past week. Over the last seven days, Nvidia +9.11%, and Tesla +5.48%, while Meta Platforms -0.04%, Apple -0.36%, Microsoft -2.37%, Alphabet -6.63%, and Amazon -12.41%.
Energy stocks had a positive performance this week, with the Energy sector itself +4.18%. WTI and Brent prices are +0.67% and +1.34%, respectively, over the past week. Over the last seven days, Marathon Petroleum +6.49%, ExxonMobil +5.40%, Phillips 66 +4.40%, Energy Fuels +4.16%, Baker Hughes +3.52%, ConocoPhillips +3.36%, APA +3.21%, Chevron +2.53%, Halliburton +2.01%, Shell +1.64%, and Occidental Petroleum +1.18%, while BP -1.05%.
Materials and Mining stocks had a positive performance this week, with the Materials sector +3.01%. Over the past seven days, Celanese Corporation +14.68%, Mosaic +8.05%, Newmont Corporation +6.63%, Freeport-McMoRan +5.82%, Albemarle +4.01%, CF Industries +2.35%, Nucor +2.35%, and Yara International +1.76%, while Sibanye Stillwater -2.63%.
European Stock Indices Price Performance
Stoxx 600 +1.73% MTD and +4.96% YTD
DAX +1.29% MTD and +1.49% YTD
CAC 40 +2.30% MTD and +2.01% YTD
IBEX 35 +0.91% MTD and +4.26% YTD
FTSE MIB +2.16% MTD and +3.48% YTD
FTSE 100 +2.43% MTD and +5.44% YTD
This week, the pan-European Stoxx Europe 600 index is +0.56%. It was +0.40% Wednesday, closing at 622.03.
So far this month in the STOXX Europe 600, Telecom is the leading sector, +8.31% MTD and +12.96% YTD, while Technology is the weakest at -4.69% MTD and +0.61% YTD.
Over the past seven days, Construction outperformed within the STOXX Europe 600, at +4.00%, followed by Basic Resources and Utilities at +3.67% and +2.99%, respectively. Conversely, Travel & Leisure underperformed at -3.50%, followed by Insurance and Banks at -3.41% and -3.07%, respectively.
Germany's DAX index was -0.53% Wednesday, closing at 24,880.41. It was +1.03% over the past seven days. France's CAC 40 index was -0.18% Wednesday, closing at 8,313.24. It was +0.62% over the past week.
The UK's FTSE 100 index was +0.67% over the past seven days to 10,472.11. It was +1.14% on Wednesday.
In Wednesday's trading session, Oil & Gas emerged as the leading outperformer, supported by strong earnings reports and higher crude prices amid heightened geopolitical tensions. Siemens Energy recorded an approximate 3x of its Q4 profit, reported significant order wins and record backlogs, and benefitted from demand for AI-driven grid and turbine solutions. TotalEnergies shares rallied after it exceeded Q4 profit expectations, raised its dividend, and reiterated its share buyback guidance. BP and EnQuest also advanced, driven by solid forecasts and new project wins.
Basic Resources tracked the commodity bid, reflecting gains in precious and certain industrial metals. ArcelorMittal shares traded higher following a rating update by Jefferies, which highlighted a structural upcycle for European steel. Wacker Chemie was lifted by an upgrade from Berenberg, which pointed to signs of recovery in EU manufacturing and improved pricing dynamics. Utilities also outperformed, as both the sector and broader industry continued to benefit from momentum in grid expansion and electrification — driven by AI CapEx on data centre build-outs. The Telecom sector also advanced. Bouygues benefitted from BNP Paribas' initiation of coverage with an outperform rating, citing hidden value in telecom and energy assets and M&A optionality.
Real Estate was relatively resilient, despite margin pressure at Barratt Redrow, where integration effects counterbalanced completion figures. The Food & Beverage sector traded higher, supported by defensive buying, with Heineken rallying as job cuts and productivity initiatives were announced aimed at restoring investor confidence after a soft 2026 guidance. Anora Group and Fevertree Drinks benefitted from stronger earnings and a rating upgrade, respectively.
Conversely, Financial Services underperformed, affected by AI-driven automation fears following the launch of Altruist's AI-enabled tax platform. The London Stock Exchange Group bucked the trend due to Elliott Management's activist stake, although broader exchanges and asset managers declined, particularly among UK names such as St James's Place, AJ Bell, Rathbones, Schroders, and Quilter.
Technology also underperformed, with Dassault Systèmes dropping to a post-IPO low after Q4 revenues narrowly rose by just 1% at constant currency and guidance for 2026 fell short of expectations. Investors were unsettled by signs of slowing growth in recurring sales, compounding fears that Dassault Systèmes, and European software firms more broadly, may be at risk amid the transition to newer, AI-driven business models. Bloomberg news also noted that European software companies face slower earnings growth than their hardware counterparts due to the impact of AI disruption.
Banks’ shares also declined, with Commerzbank shares down due to a cautious guidance for 2026, despite exceeding profit expectations. Unicaja and ABN Amro also declined following a rating downgrade and Q4 earnings report, respectively. Travel & Leisure also underperformed, as Lufthansa and its peers slipped in anticipation of widespread flight disruptions expected today due to strikes by both pilot and cabin crew unions. EasyJet, however, traded higher following an upgrade by Citi.
Other Global Stock Indices Price Performance
MSCI World Index +0.91% MTD and +3.13% YTD
Hang Seng -1.29% MTD and +5.47% YTD
Over the past seven days, the MSCI World Index and Hang Seng Index are -1.05% and +1.18%, respectively.
Currencies
EUR +0.19% MTD and +1.06% YTD to $1.1870
GBP -0.46% MTD and +1.13% YTD to $1.3625
On Wednesday, the US dollar advanced against both the euro and the Swiss franc as stronger than expected labour market data reduced the chances of further Fed rate cuts.
The US dollar index rose +0.05% to 96.91. Over the week the index declined -0.75%. The dollar index is -0.25% MTD and -1.39% YTD.
The dollar was +0.42% versus the Swiss franc, reaching 0.7711, while the euro declined -0.20% against the dollar to $1.1870. Over the past seven days, the euro was +0.54%.
Sterling also weakened, falling -0.11% against the dollar to $1.3625. This marked a decline of -0.20% over the last seven days.
The Japanese yen continues to outperform following Prime Minister Sanae Takaichi's decisive election victory. The yen appreciated by +0.74% against the US dollar on Wednesday, reaching ¥153.24 per dollar, marking its third consecutive session of gains.
Since 30th January, the yen has appreciated by +0.98%. Furthermore, over the course of the past seven days, it is +2.30% against the US dollar.
Note: As of 5:00 pm EST 11 February 2026
Cryptocurrencies
Bitcoin -19.53% MTD and -22.71% YTD to $67,776.41
Ethereum -27.18% MTD and -33.88% YTD to $1,969.54
Bitcoin is -6.68% over the last seven days and Ethereum is -7.36%. On Wednesday, Bitcoin was -1.24% to $67,776.41 and Ethereum was -1.90% to $1,969.54.
The divergence between equity and cryptocurrencies markets expanded this week as risk appetite eroded on rising geopolitical fears and data indicating that the US labour market remains strong, reducing the likelihood of Fed cuts. The total digital asset market cap has fallen from $3.1 trillion a month ago to $2.37 trillion. Last week, Bitcoin plunged to $62,800, its lowest in 14 months, before partially recovering to $71,500 on Sunday before falling again on Wednesday’s stronger than expected labour market data. Friday’s inflation data will be a significant contributing factor to further movements. If inflation comes in lower than expected, it may provide some support to the Fed considering an easing of rates. This general easing of financing conditions by lowering discount rates and encouraging greater risk-taking, has historically supported equities and crypto. However, if inflation remains hot, Treasury yields will remain elevated, meaning financing costs and discount rates will stay elevated, adding pressure to cryptocurrencies.
Despite what appears to be a bottoming out of the market, JPMorgan thinks that fundamentals and rising institutional inflows could lift crypto in 2026. As noted by CoinDesk, the bank believes that demand by institutional investors will grow supported by increased regulatory clarity in the US and that falling production costs will cause a self correction of the price.
Note: As of 5:00 pm EST 11 February 2026
Fixed Income
US 10-year yield -6.1 bps MTD and +0.5 bps YTD to 4.177%
German 10-year yield -4.9 bps MTD and -6.2 bps YTD to 2.798%
UK 10-year yield -4.9 bps MTD and +0.3 bps YTD to 4.481%
US Treasury yields moved higher on Wednesday, following a much stronger-than-expected January nonfarm payrolls report that dented expectations for an imminent rate cut by the Fed. The yield on the 10-year Treasury note climbed +2.9 bps to 4.177%, having earlier touched a session peak of 4.206%. The yield on the 30-year bond edged up +0.6 bps to 4.809%, after reaching an intraday high of 4.834%. The two-year Treasury yield, closely linked to expectations for Fed funds rate expectations, advanced +6.5 bps, marking its largest daily increase since 29th October, to reach 3.529%.
The spread between two- and 10-year Treasury yields stood at 64.8 bps, 7.9 bps narrower than the previous week’s level of 72.7 bps.
Over the past seven days, the yield on the 10-year Treasury note was -10.3 bps. The yield on the 30-year Treasury bond was -11.0 bps. On the shorter end, the two-year Treasury yield was -2.4 bps.
After a successful auction of $58 billion in three-year notes on Tuesday, the subsequent $42 billion auction of 10-year notes was considered soft by analysts, as it attracted a bid-to-cover ratio of 2.39x — falling short of the recent refunding average of 2.46x.
The market faces further supply today, with the Treasury set to offer $25 billion in 30-year bonds.
According to CME Group's FedWatch Tool, traders are pricing in 52.5 bps of cuts in 2026, higher than the 49.7 bps priced in last week. Fed funds futures traders are now pricing in a 5.4% probability of a 25 bps rate cut at March’s FOMC meeting, down from 23.2% last week.
Market expectations for a June FOMC rate cut of at least 25 bps dropped from 75.0% to 60.3%.
Across the Atlantic, in the UK, on Wednesday the 10-year gilt was -3.8 bps to 4.481%. Over the past seven days, it was -7.6 bps.
Euro area government bonds outperformed their US counterparts on Wednesday. Germany’s 10-year bond yield slipped-1.6 bps to 2.798%, having reached an intraday low of 2.793%, its lowest since 14th January.
With inflation in the eurozone hovering near target and signs of improving growth, markets are not anticipating any policy moves from the ECB this year. Traders now see only a 20% chance of a rate cut by December.
Germany’s two-year yield, which is particularly sensitive to ECB policy expectations, was +0.6 bps to 2.074% after hitting its lowest level since 1st December at 2.040% earlier in the session. Further along the curve, the 30-year yield dropped by -3.3 bps to 3.458%.
Over the past seven days, the German 10-year yield was -6.6 bps. Germany's two-year bond yield was -2.8 bps, while Germany's 30-year yield was -7.0 bps.
The yield spread between German Bunds and 10-year UK gilts reached 168.3 bps on Wednesday, a contraction of 1.0 bps over the past seven days.
The spread between US 10-year Treasuries and German Bunds is now 137.9 bps, 3.7 bps lower from last week’s 137.9 bps.
The spread between Italian BTP 10-year yields and German Bund 10-year yields stood at 60.8 bps, 0.4 bps lower than last week’s spread of 61.2 bps. The Italian 10-year yield was -7.0 bps over the last week.
Over the course of the week, France’s 10-year yield has declined -6.4 bps. The spread between the French OAT 10-year yield and German Bund 10-year yield stood at 58.8 bps, 0.2 bps higher than last week’s 58.6 bps.
Commodities
Gold spot +4.49% MTD and +17.82% YTD to $5,082.70 per ounce
Silver spot -0.39% MTD and +23.73% YTD to $84.29 per ounce
West Texas Intermediate crude -1.28% MTD and +13.05% YTD to $64.90 a barrel
Brent crude -1.47% MTD and +14.37% YTD to $69.66 a barrel
Gold prices climbed over one percent on Wednesday, buoyed by consistent long-term buying which helped the precious metal recover its momentum after a brief pullback.
Spot gold rose +1.18%, reaching $5,082.70 per ounce. Over the last seven days, gold prices have advanced +2.41%.
Gold experienced sharp two-day sell-offs on 30th January and 2nd February following the US President’s announcement of his nominee for Fed Chair. Nevertheless, the metal has advanced +17.82% thus far this year, extending last year’s record gains as ongoing geopolitical and economic uncertainty, alongside increased central bank purchases, continue to support demand.
Spot silver also advanced, up +4.35% at $84.29 per ounce, rebounding after a -3.10% decline in the previous session following a report published by the Silver Institute suggesting that silver will remain in deficit for a sixth consecutive year. Over the last week, silver prices have declined -4.40%.
Oil prices moved higher on Wednesday, fuelled by growing concerns over escalating tensions between Washington and Tehran as the two sides prepared to resume negotiations.
Brent crude futures closed up 65 cents, or +0.94%, at $69.66 a barrel. US WTI crude rose by 70 cents, or +1.09%, to settle at $64.90. Over the last seven days, WTI is +0.67% and Brent +1.34%.
Following a meeting with Israeli Prime Minister Benjamin Netanyahu on Wednesday, the US President indicated that while no firm decisions had been reached, negotiations with Iran towards a potential agreement would continue.
OPEC’s latest monthly report left its supply-demand forecasts largely unchanged, but noted that global demand for the wider group’s crude is expected to decrease by 400,000 barrels per day in Q2 compared to Q1. Additionally, the report showed that Russian oil production slipped around 0.6% in January from December levels.
EIA report. According to the Energy Information Administration (EIA), US crude oil inventories increased last week, a result of reduced refining and export activity during a winter storm last month. Domestic production began to recover from the earlier freeze.
Crude oil inventories rose by 8.5 million barrels—the largest weekly increase in a year—bringing the total to 428.8 million barrels for the week ending 6th February, as reported by the EIA. Stocks at the Cushing, Oklahoma, delivery hub climbed by 1.1 million barrels. US crude production also advanced, rising by 500,000 barrels per day (bpd) to reach a total of 13.71 million bpd.
Net US crude imports increased by 912,000 bpd, according to the EIA. Imports to the US Gulf Coast reached their highest level since December 2024. US crude exports fell 308,000 bpd to 3.7 million bpd last week.
Refinery crude throughput decreased by 29,000 bpd, while refinery utilisation declined by 1.1 percentage points, bringing the utilisation rate to 89.4% for the week.
US gasoline inventories grew by 1.2 million barrels, reaching 259.1 million barrels—the highest level since April 2020. In contrast, distillate stockpiles, which encompass diesel and heating oil, decreased by 2.7 million barrels to 124.7 million barrels.
The total product supplied — a key indicator of demand — fell by 245,000 bpd to 21.11 million bpd. Gasoline demand increased by 147,000 bpd to 8.3 million bpd, although it remained below the four-week moving average and was lower than a year ago. Distillate demand rose 138,000 bpd to 4.45 million bpd.
Note: As of 5:00 pm EST 11 February 2026
Key data to move markets
EUROPE
Thursday: Speeches by ECB Board member Piero Cipollone, ECB Chief Economist Philip Lane, and Bundesbank President Joachim Nagel
Friday: GDP, Employment Change, Spanish Harmonised Index of Consumer Prices, and speech by ECB Executive Board Vice President Luis de Guindos
Saturday: A speech by ECB President Christine Lagarde
Sunday: A speech by ECB President Christine Lagarde
Monday: Industrial Production
Tuesday: Germany’s CPI and Harmonised Index of Consumer Prices, ZEW Survey Current Situation and Economic Sentiment, and Eurozone ZEW Survey Economic Sentiment
UK
Thursday: GDP, Industrial Production, and Manufacturing Production
Friday: A speech by BoE Chief Economist Huw Pill
Tuesday: Claimant Count Rate and Change, Employment Change, ILO Unemployment Rate, and Average Earnings
Wednesday: CPI, PPI, PPI Core Output, and Retail Price Index
USA
Thursday: Initial and Continuing Jobless Claims, Existing Home Sales, and speeches by Dallas Fed President Lorie Logan and Fed Governor Stephen Miran
Friday: CPI and Core CPI
Monday: Bond and Stock markets closed for President’s Day
Tuesday: ADP Employment Change 4-week Average, New York Empire State Manufacturing Index and a speech by San Francisco Fed President Mary Daly
Wednesday: Durable Goods Orders, Nondefence Capital Goods Orders ex Aircraft, Building Permits, Housing Starts, and FOMC Minutes
JAPAN
Sunday: GDP
Tuesday: Exports, Imports, Merchandise Trade Balance, and Adjusted Merchandise Trade Balance
Global Macro Updates
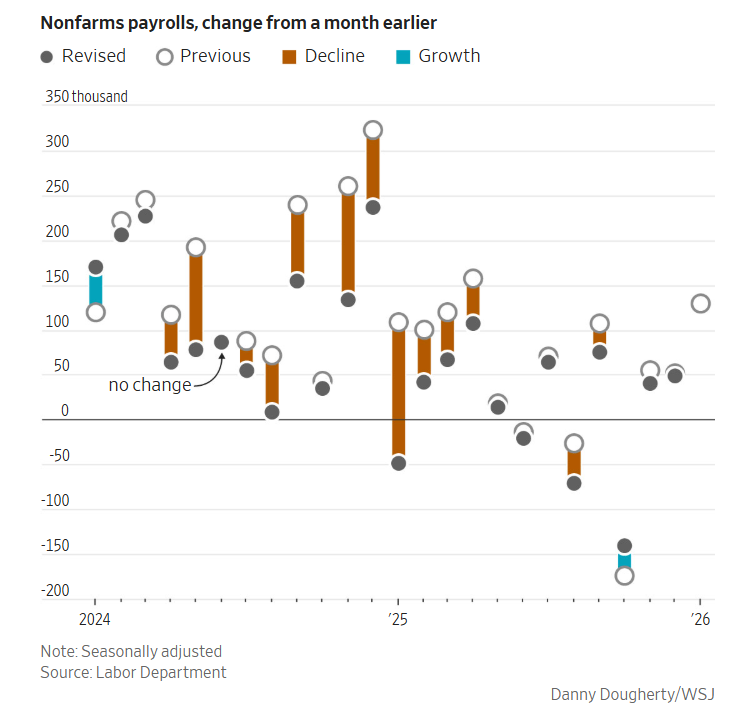
January NFP. According to the Bureau of Labor Statistics, headline nonfarm payrolls increased by 130,000, substantially exceeding the consensus forecast of 70,000. Private payrolls rose by 172,000, compared to the anticipated 75,000, marking the highest figures since December 2024.
The unemployment rate declined by 0.1 percentage points to 4.3%. Average hourly earnings rose by 0.4% on a m/o/m, surpassing the consensus of 0.3%, while average hours worked increased to 34.3. Nonetheless, job gains were relatively concentrated, with Education and Health adding 137,000 roles, Professional and Business Services contributing 34,000, and Construction increasing by 33,000 positions.
The report also featured the annual benchmark revision, which indicated that there were 862,000 fewer jobs in the twelve months through March than previously estimated. However, this figure is an improvement from the 911,000 estimated in September.
Some analysts expressed caution, attributing a considerable portion of January's upside surprise to methodological changes in the estimation of net business formation, rather than genuine economic strength. They noted that this adjustment boosted January job growth by approximately 70,000 relative to December. Other analysts interpreted the report as hawkish, considering it a validation of economic resilience and hinting at the beginning of a potential recovery. Furthermore, analysts indicated that the report supports the prevailing view that the FOMC, under Chairman Powell, is unlikely to cut again.
CBO projects wider deficits, higher-for-longer inflation. According to the Congressional Budget Office’s Budget and Economic Outlook: 2026 to 2036, the projected budget deficit for 2026 stands at $1.9 trillion, reflecting an 8% increase over the January 2025 estimate. Publicly held federal debt is expected to reach 101% of GDP this year and rise to 120% by 2036, well above the post-World War II peak of 106%.
These revisions are primarily the result of a $4.7 trillion increase in ten-year deficits attributed to the 2025 Reconciliation Act and an additional $0.5 trillion from recent immigration measures. However, these increases are partially offset by a $3 trillion reduction in deficits due to higher tariff revenues. Interest payments are projected to rise to 3.3% of GDP in 2026 and further to 4.6% by 2036, at which point interest will constitute approximately 20% of total federal spending. Customs duties are forecast to reach 1.3% of GDP, or $418 billion, this year, surpassing corporate income tax receipts for the first time since 1934. The CBO doesn’t expect inflation to return to the Federal Reserve’s 2% target until 2030, later than previously forecast, due to secondary price effects stemming from tariffs.
The analysis indicates that 95% of the burden of tariffs falls on US businesses and consumers, with foreign exporters absorbing only 5%. It is further noted that American businesses are expected to absorb approximately 30% of import price increases, passing on the remaining 70% to consumers through higher prices. The trade deficit is forecast to decline from 2.7% of GDP in 2025 to 1.6% by 2036, as increased tariffs reduce the volume of imports. However, the US dollar is anticipated to depreciate by 9.6% over the next decade as trade flows adjust accordingly.
What are the implications of these two reports? Taken together, the January employment report and the CBO's updated fiscal outlook depict an economy caught between conflicting forces. The labour market remains in a ‘low-hire, low-fire’ equilibrium. This leaves the labour market less dynamic and increasingly exposed to downside shocks. Even so, the decline in the unemployment rate and above-consensus wage growth lend a hawkish tilt to the data, reinforcing the view that the FOMC will keep rates steady, with markets now pushing out the expected first cut from June to July. For US Treasuries, this combination of sticky inflation and a Fed on pause removes a key source of near-term duration demand, keeping upward pressure on yields across the curve.
The CBO's latest projections amplify these dynamics by revealing a materially deteriorating fiscal backdrop. Although tariff revenues partially offset the cost of the 2025 Reconciliation Act, it generates secondary price effects that delay the return to the Fed's 2% inflation target until 2030. The expanding supply of Treasury issuance needed to finance these deficits, combined with a longer-than-expected path back to price stability, points to rising term premia and a structural repricing of the fiscal risk embedded in long-end yields. The net result is a policy environment defined by a tug-of-war: expansionary fiscal policy and tariff-driven cost increases sustain near-term demand and stoke inflation, while the Fed's need to preserve credibility on price stability keeps monetary policy restrictive. This leaves the economy navigating a ‘stagflation lite’ corridor with diminishing fiscal space and weakening debt sustainability.
While every effort has been made to verify the accuracy of this information, EXT Ltd. (hereafter known as “EXANTE”) cannot accept any responsibility or liability for reliance by any person on this publication or any of the information, opinions, or conclusions contained in this publication. The findings and views expressed in this publication do not necessarily reflect the views of EXANTE. Any action taken upon the information contained in this publication is strictly at your own risk. EXANTE will not be liable for any loss or damage in connection with this publication.
本文提供给您仅供信息参考之用,不应被视为认购或销售此处提及任何投资或相关服务的优惠招揽或游说。金融工具交易存在重大亏损风险,未必适合所有投资者。过往表现并非未来业绩的可靠指标。


由专业人士创建。 为专业人士。
