
Is it time for investors to think about the chokepoint premium?

Markets in April
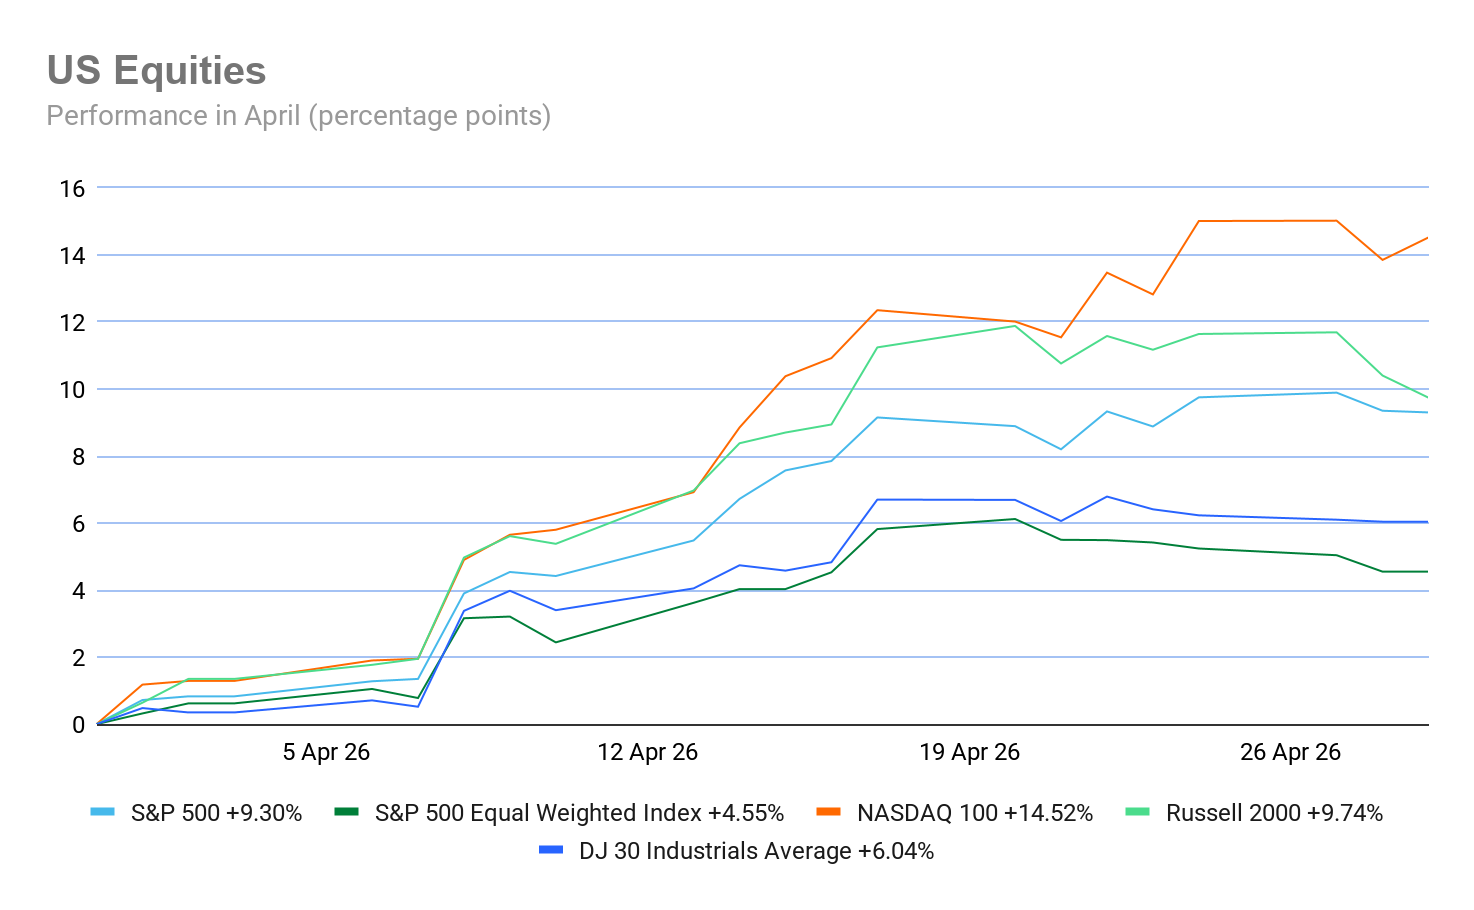
April has seen US equity markets soar with both the S&P 500 and the Nasdaq hitting new highs as the megacaps all rose on positive EPS expectations. The (MTD) performance: S&P 500 +9.30%, Nasdaq 100 +14.52%, Dow Jones Industrial Average +6.04 % and the Russell 2000 +8.86%.
Global bond markets saw yields rise this month as uncertainty around inflation expectations kept central banks cautious. However, there has also been bond flattening in US yields, with the US yield curve flattening by 4.4 bps, with the spread between two- and 10-year yields at 46.9 bps on Wednesday from 51.3 bps at the end of March. This indicates increasing investor uncertainty and falling confidence in future economic growth. The Fed and the BoJ all kept rates on hold while warning that the increase in global energy price due to the war with Iran is raising inflation, with the BoJ revising its inflation estimates upwards as the Iran war raises supply-side risks. The US dollar is down overall so far this month despite a recovery in the latter part of the month. The US dollar index is -0.92% MTD as safe haven demand has fallen on a continuing ceasefire agreement, increased risk appetite and the re-emergence of concerns around US debt levels and political pressure on the Fed. Gold fell again in April as expectations of higher for longer rate environments remained and yields rose, making the non-yielding asset less attractive.
The economic picture
USA: US economic data has been somewhat contradictory for April. The labour market seems to be holding relatively steady, with nonfarm payrolls rising 178,000 in March, the most since the end of 2024, after revisions showed a sharper decline in February to a 133,000 drop, which marked one of the biggest declines since the Covid pandemic. However, on average, payrolls rose 68,000 in the first three months of this year according to Bureau of Labor Statistics data. The unemployment rate fell to 4.3% as the participation rate — the share of the population that is working or looking for work — slid to 61.9% in March, the lowest since 2021. Additionally, according to ADP, private sector employment increased by 62,000 jobs in March and pay was up 4.5% y/o/y. On the growth front, business activity rose in April after an almost stagnant March due to the outbreak of the war with Iran. The April Flash S&P Global Composite PMI index came in at a 3-month high of 52.0, up from March’s 50.3 reading, signalling faster economic growth at the start of Q2. Cooling demand growth resulted in the Flash Services PMI coming in at only 51.3. Although this was up from March’s 49.8 and a 2-month high, New business placed rose only marginally and at the slowest rate seen over the past two years due to the decline in exports. However, the Flash Manufacturing PMI rose to 54.0, up from March’s 52.3 and an impressive 47-month high, but this was at least partly due to the building of safety stocks as a result of panic and emergency buying ahead of further expected price hikes and supply shortages. On the consumer side, the April reading of the University of Michigan confidence survey indicated that US consumer sentiment fell again this month from 53.3 in March to 49.7, a 6.6% drop. Expected business conditions declined for both short and long time horizons. Year-ahead inflation expectations surged from 3.8% in March to 4.7%. Long-run inflation expectations climbed to 3.5% in April, the highest reading since October 2025. Annualised inflation rose to 3.3% in March, significantly up from 2.4% in February, according to the Bureau of Labor Statistics. It was +0.9% on a seasonally adjusted basis m/o/m basis in March after rising 0.3% in February. Core annualised CPI was +2.6% y/o/y and 0.2% m/o/m. However, the Fed's favoured inflation measure, the core PCE price index, was +3% in February and +0.4% m/o/m.
EU: The euro area is sending stagflationary signals with eurozone headline inflation expected to rise to around 3% in April as a result of the energy shock. Core prices are expected to remain relatively stable for now at around 2.6%, but price pressures are likely to build throughout 2026, as energy costs feed through with a lag via secondary effects. Eurozone headline inflation in March rose to 2.6% y/o/y, up from 1.9% in February. Core inflation in March was slightly down from February’s 2.4% y/o/y to 2.3% year-on-year. The closely watched services gauge fell to 3.2% from 3.4% in February. Euro area annual inflation is expected to be 3.0% in April, up from 2.6% in March according to a flash estimate from Eurostat. Inflation expectations among euro-area consumers also jumped in March, with the ECB Consumer Expectations Survey results indicating inflation expectations over the next twelve months rose to 4%, up from February’s expectations of a 2.3% rise. Expectations for inflation three years ahead rose to 3.0% from 2.5%, while iInflation expectations for five years ahead also increased in March, rising to 2.4% from 2.3% in February. In terms of euro area growth, the war with Iran and the uncertainty it creates is driving the economy into contractionary territory while inflation moves sharply higher. The S&P Flash Eurozone Composite PMI dropped to 48.6 from March’s 50.7, hitting a 17-month low. The Flash Services PMI came in at 47.4 from March’s 50.2, a 62-month low. However, manufacturing production increased, with the Flash Manufacturing PMI coming in at 52.2, up from March’s 51.6 and a 47-month high. The war in the Middle East has caused substantial supply chain delays in the eurozone manufacturing sector with supplier lead times lengthening to the largest extent since July 2022. Manufacturers are only benefitting as demand for goods is being buoyed by stock building as companies rush to secure purchases ahead of further price hikes or supply shortages. Services employment rose slightly, with manufacturing seeing a decrease. As noted by Eurostat, in February 2026, the latest date for employment data, the euro area seasonally adjusted unemployment rate was 6.2%, up from 6.1% in January.
What is clear is that European consumers are losing confidence. According to the European Commission, there was a plunge in euro area consumer confidence in April with the flash estimate of the consumer confidence indicator falling -4.2 percentage points to -20.6 points, markedly below its long-term average and reaching its lowest level since the turn of 2022/23.
UK: The UK economy appears to be bouncing back from the slowdown caused by the war in Iran, but there are warning signs on the horizon. According to the Office for National Statistics, the UK unemployment rate fell by 0.2 percentage points to 4.9%. However, the UK economic inactivity rate rose by 0.3 percentage points to 21%. The S&P Global Flash Composite PMI rose to 52.0 in April, up from March’s 50.3 and a 2-month high. The Flash Services PMI also rose, coming in at 52.0 from March’s 50.5. The Flash Manufacturing PMI had the biggest change, rising to 53.6 from March’s 51.0 and a 47-month high. However, input cost inflation continued to accelerate and was the highest since November 2022. This was led by a rapid increase in raw material prices in the manufacturing sector. It appears that the rise may be due to the building out of safety stocks in the expectation of rising prices and supply constraints. Nevertheless, private sector employment numbers fell for the nineteenth month running in April, although the rate of job shedding was the slowest since October 2025. Business optimism at UK private sector firms fell to its second-weakest since December 2022 as price pressures weighed on business activity expectations.
Inflation in the UK remains above the BoE target with headline CPI rising to 3.3% in March from 3.0% in February, and was up 0.7% m/o/m compared with a rise of 0.3% in March 2025. Core inflation was 3.1% in March 2026, down slightly from 3.2% in February. March’s data also showed a rise to 4.5% in the 12 months to March 2026, up from 4.3% in the 12 months to February.
Global market indices
USA:
S&P 500 +9.30% MTD and +4.24% YTD
Nasdaq 100 +14.52% MTD and +7.67% YTD
Dow Jones Industrial Average +6.04% MTD and +2.24% YTD
NYSE Composite +3.00% MTD and +3.40% YTD
Source: FactSet
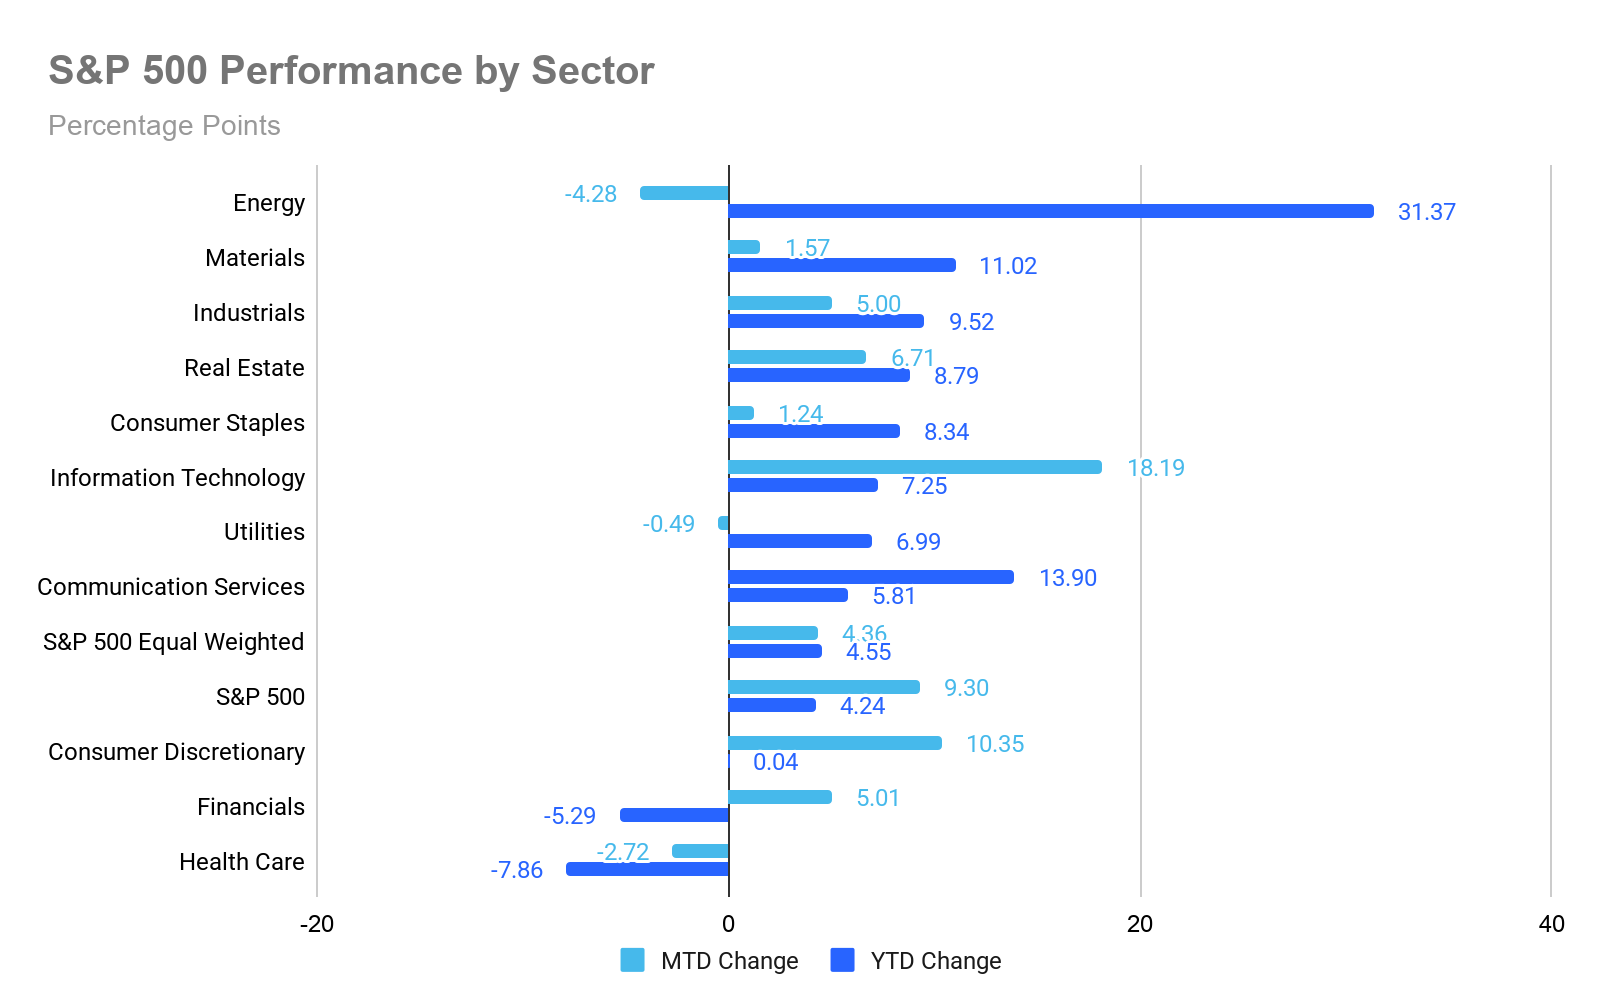
The Equally Weighted version of the S&P 500 is +4.36% MTD so far in April, 4.94 percentage points lower than the benchmark.
The S&P 500 Information Technology sector is the top performer thus far in April at +18.19% MTD and +7.25% YTD, while Energy underperformed -4.28% MTD and +31.37% YTD.
On Wednesday the S&P 500 -0.04%, the Nasdaq Composite +0.04%, and the Dow Jones Industrial Average was -0.57%.
In corporate news, Qualcomm, the leading producer of smartphone processors, issued a subdued forecast for the current period, further underscoring the impact of the ongoing industrywide memory chip shortage on the mobile device sector.
Ford Motor raised its full-year profit guidance, attributing the improvement to robust demand for its high-margin pickup trucks and SUVs, which is expected to offset the impact of a significant and unforeseen increase in commodity costs.
Mattel exceeded revenue expectations in the first quarter, driven by strong demand for Hot Wheels miniature cars and building sets, which mitigated weaker sales of Barbie dolls and Fisher-Price preschool products.
Europe:
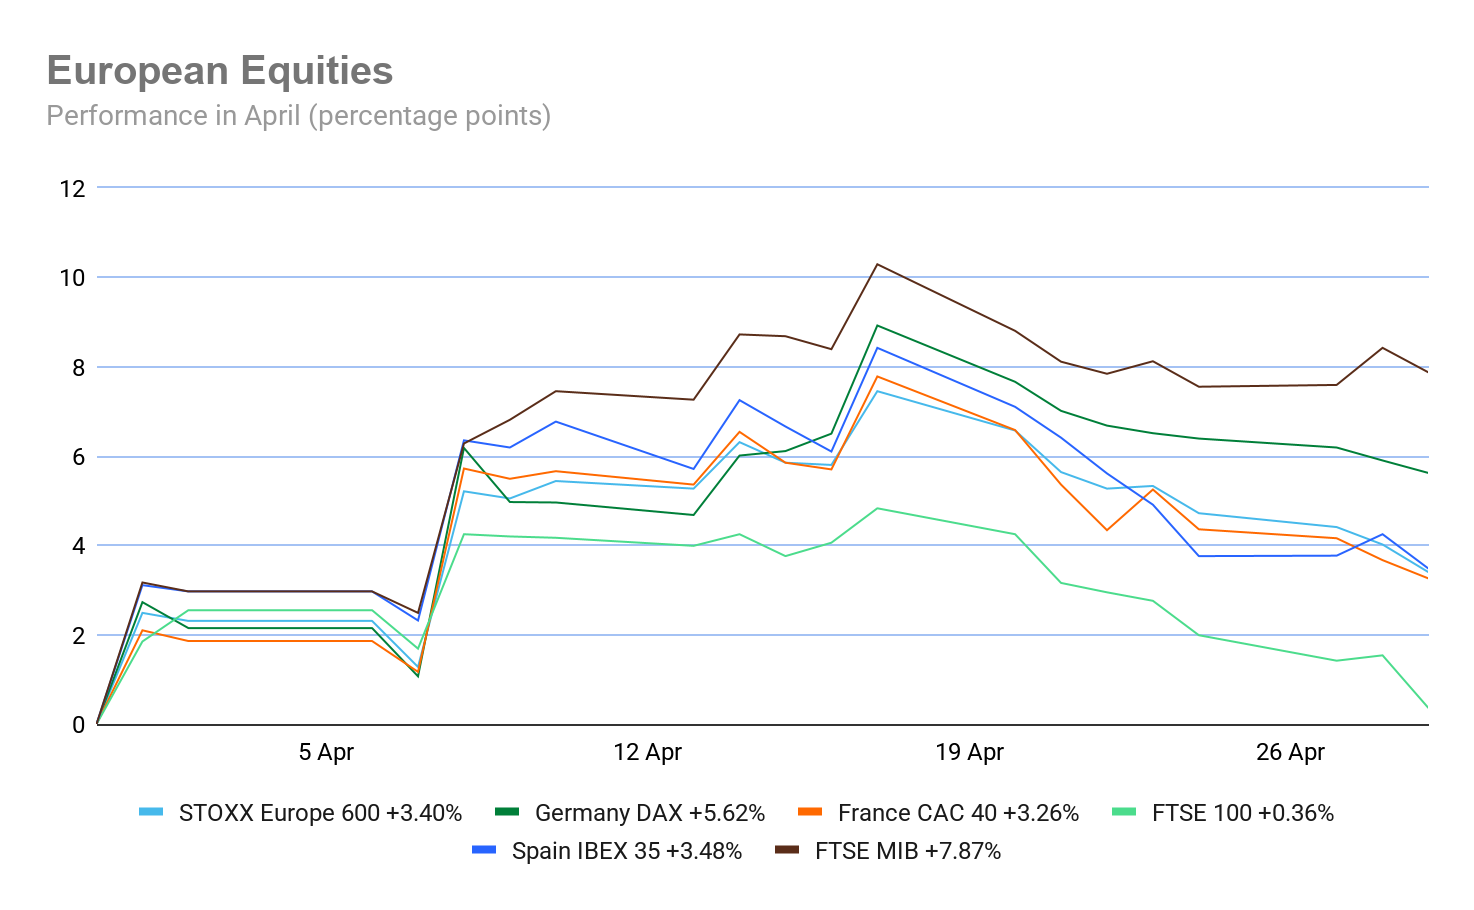
Stoxx 600 +3.40% MTD and +1.82% YTD
DAX +5.62% MTD and -2.19% YTD
CAC 40 +3.26% MTD and -0.95% YT
FTSE 100 +0.36% MTD and +2.84% YTD
IBEX 35 +3.48% MTD and +1.94% YTD
FTSE MIB +8.42% MTD and +6.89% YTD
Source: FactSet
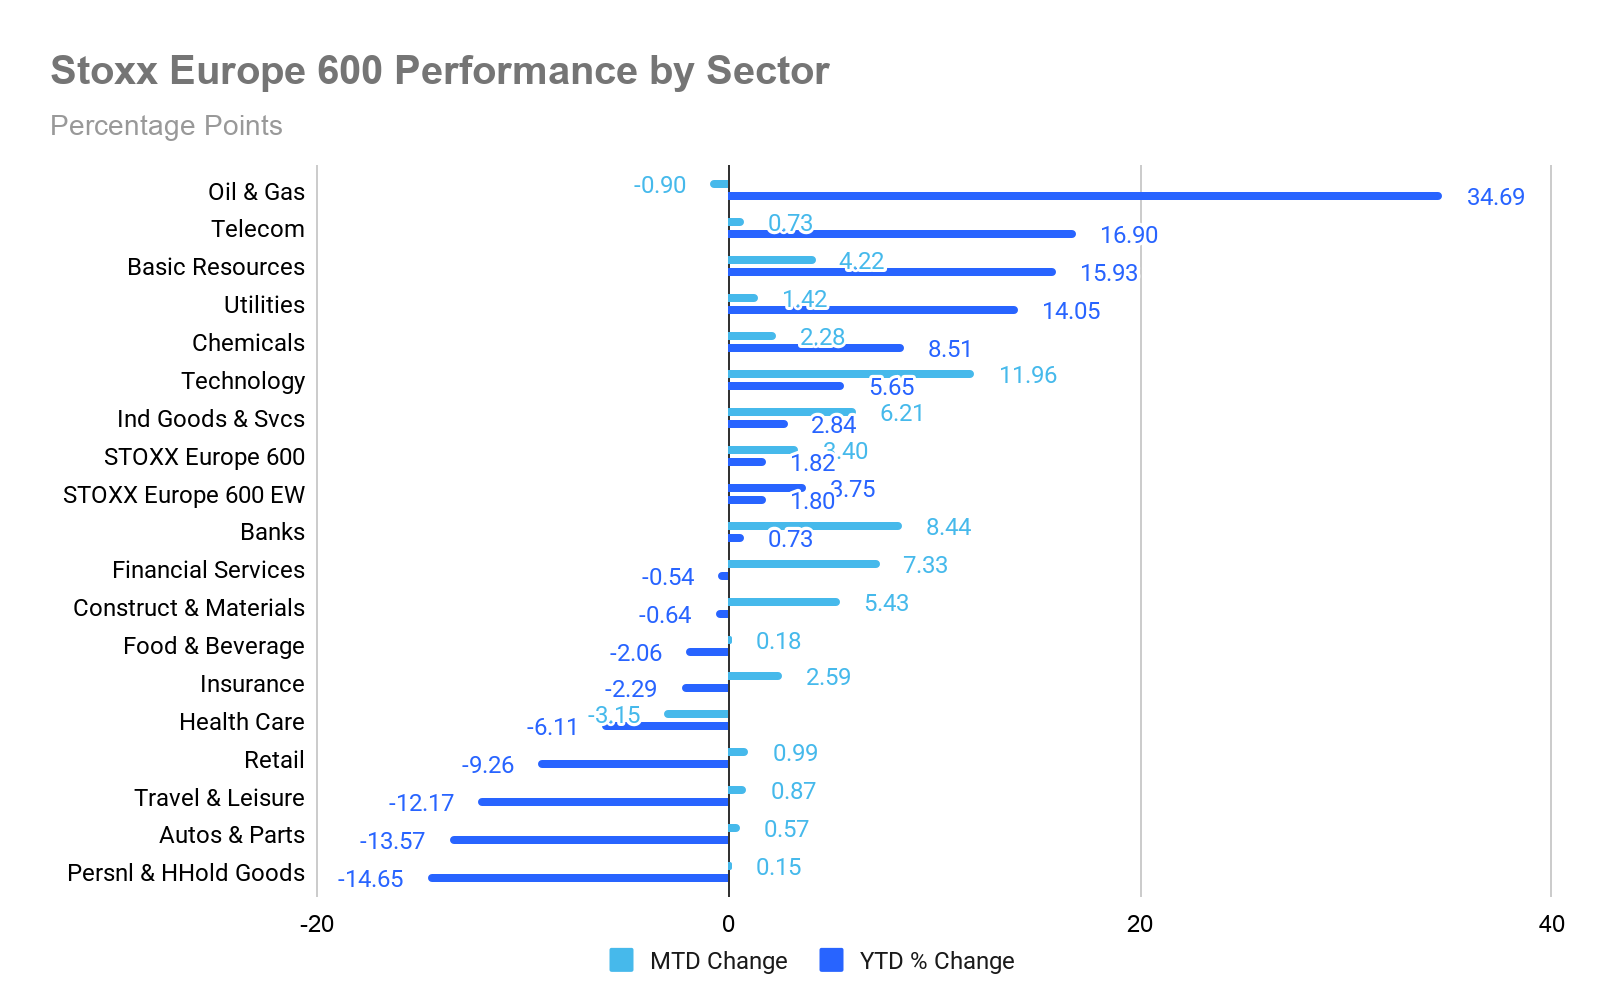
In Europe, the Equally Weighted version of the Stoxx 600 is +3.75% MTD, 0.35 percentage points higher than the benchmark.
The Stoxx 600 Technology is the leading sector, +11.96% MTD and +5.65% YTD, while Health Care exhibited the weakest performance at -3.15% MTD and -6.11% YTD.
Oil & Gas emerged as one of the leading performers on Wednesday, supported by firm crude prices amid continued geopolitical tensions in the Middle East and the ongoing blockade of the Strait of Hormuz. In earnings, TotalEnergies rallied following Q1 beats on adjusted Net Income and EBITDA. The company announced increases in both its dividend and share buyback programme, supported by strong downstream trading performance. Similarly, Neste shares advanced after reporting robust renewable margins and strong beats on key metrics for the quarter, while also confirming its FY guidance.
Telecommunications traded higher, driven by strength among equipment providers. Appear rose sharply on the back of solid Q1 results and upbeat guidance, though Hexatronic declined due to margin volatility. Service providers showed less resilience, with Royal KPN declining after missing profit estimates and providing a softer EBITDA outlook.
Financial Services were supported by earnings from UBS, which reported an 80% increase in Q1 profit, a strong capital position, and progress in its integration of Credit Suisse, alongside the confirmation of a $3 billion share buyback. Deutsche Bank exceeded Q1 estimates, but faced declines due to rising loan losses and concerns over capital ratios. Amundi and Santander reported strong inflows and resilient fee income during the quarter, although provisions for motor finance weighed on profitability.
Technology staged a modest recovery after the previous session's sell-off, benefitting from global enthusiasm for AI and digital platforms. US peers NXP Semiconductors and Seagate reported upbeat results and guidance, reflecting continued demand for memory chips and data storage solutions. In Basic Resources, attention was focused on Norsk Hydro, which exceeded expectations amid tight markets affected by Iran-related disruptions, while Thyssenkrupp benefitted from Kone's €29.4 billion acquisition of TK Elevator.
Retail underperformed every other sector, with apparel retailers under pressure. Salvatore Ferragamo fell after a negative analyst initiation, citing structural challenges and limited exposure to the Chinese market. On a positive note, Adidas advanced after surpassing Q1 estimates, driven by strong demand for sportswear and a confirmation of its long-term guidance, while Halfords surged after exceeding full-year sales forecasts and issuing an upbeat outlook.
Insurance underperformed as both life and non-life insurers faced headwinds. Zurich Insurance weakened following a financial condition update, though Gjensidige exceeded Q1 estimates and posted robust solvency targets. Both Utilities and Real Estate sectors lagged as bond proxies came under pressure ahead of central bank decisions from the Fed, ECB and BoE, with limited support from company-specific developments.
In Health Care, Q1 earnings from GSK and AstraZeneca failed to spark rallies amid ongoing macroeconomic challenges. Haleon faced pressure due to concerns over its overall guidance. Travel & Leisure remained subdued on apprehension surrounding the potential impact of the fuelIran conflict on fuel costs, resulting in a cautious outlook for airlines and leisure companies. Ryanair CEO Michael O’Leary warned that European airlines could face significant headwinds if jet fuel prices remain elevated throughout the summer.
Global:
MSCI World Index +8.18% MTD and +3.98% YTD
Hang Seng +5.34% MTD and +1.88% YTD
Mega cap stocks have had a decidedly positive performance MTD as the next twelve month EPS estimates increased throughout the month. Thus far in April, Amazon +26.30%, Alphabet +21.69%, Nvidia +19.98%, Meta Platforms +16.95%, Microsoft +14.67%, Apple +6.45% and Tesla +0.28%.
Energy stocks experienced a mostly negative performance so far in April with the Energy sector -4.28% MTD. So far in April, Baker Hughes Company +12.71%, Halliburton +7.23% and Energy Fuels +5.10%, while Marathon Petroleum -0.97%, ConocoPhillips -2.84%, Phillips 66 -4.77%, Apa Corp -5.00%, Occidental Petroleum -6.52%, Chevron -7.10%, Shell -8.46% and ExxonMobil -8.84%.
Materials and Mining stocks have had a mostly negative performance MTD in April. The Materials sector is +1.57% MTD. So far this month, Nucor Corporation +31.51% and Albemarle +6.32%, while Newmont Mining -0.59%, Celanese Corporation -1.03%, CF Industries Holdings -2.36%, Freeport-McMoRan -3.15%, Yara International -5.64%, Sibanye Stillwater -5.72% and Mosaic -9.69%.
Commodities
On Wednesday, gold prices extended losses, reaching a one-month low following the Fed's decision to keep interest rates unchanged, as anticipated.
Spot gold declined by -1.18% to $4,540.35 per ounce, marking its lowest valuation since late March. It is -3.39% MTD and +5.24% YTD.
According to the World Gold Council, global demand for gold increased by 2% y/o/y in Q1. This rise was driven by robust purchases of gold bars and coins and a 3% uptick in central bank acquisitions, which offset a 23% decrease in jewelry demand.
Spot silver prices declined on Wednesday, falling -2.17% to $71.48 per ounce. It is -4.82% MTD and +0.31% YTD.
Oil prices surged over eight percent on Wednesday to their highest levels in several weeks. This increase was fuelled by ongoing deadlock in negotiations between the US and Iran, heightening concerns about prolonged disruptions to Middle Eastern oil supplies.
Brent crude futures for June rose for the eighth consecutive session, closing up $8.96, or +8.06%, at $120.12 per barrel, the highest since 31 March. US WTI futures for June climbed $8.87, or +8.90%, to $108.49 per barrel, the highest since 7 April.
Brent is +1.53% MTD and +88.97% YTD, while WTI is +6.82% MTD and +88.97% YTD.
Overnight, the US President reportedly directed his administration to prepare for an extended blockade of Iran and informed oil executives at the White House that the blockade could persist for months.
Axios reported that President Trump rejected Iran's proposal to reopen the Strait of Hormuz and end the US blockade, opting to postpone discussions regarding Iran's nuclear programme. Additionally, sources indicated that US Central Command is preparing a new set of ‘short and powerful strikes’ against Iran, aiming to resolve the impasse in negotiations.
Looking ahead, OPEC-7 is expected to increase its combined output quotas for June by 206,000 barrels per day (bpd), excluding the UAE's 18,000 bpd share, according to group sources. Several analysts believe the UAE's decision to exit OPEC will have minimal immediate impact, though it could prompt other nations to reconsider their membership once the Strait of Hormuz eventually reopens.
In addition, China has approved fuel export quotas totalling 500,000 metric tons for May, excluding Hong Kong, according to Reuters trading sources. Reports from the previous day suggested that state-owned Chinese refiners were advocating for the removal of fuel export bans.
EIA report. According to the EIA’s report released Wednesday, US crude oil refinery inputs averaged 16.1 million barrels per day during the week ending 24 April. This was 85 thousand barrels per day more than the previous week’s average. Refineries operated at 89.6% of their operable capacity last week. Gasoline production decreased last week, averaging 9.8 million barrels per day. Distillate fuel production decreased, averaging 4.9 million barrels per day.
US crude oil imports averaged 5.8 million barrels per day last week, a reduction of 329 thousand barrels per day from the previous week. Over the past four weeks, crude oil imports averaged about 5.9 million barrels per day, 0.7% more than the same four-week period last year.
US commercial crude oil inventories were 6.2 million barrels down from the previous week. At 459.5 million barrels, US crude oil inventories are about 1% above the five-year average for this time of year. Total motor gasoline inventories fell by 6.1 million barrels from last week and are 2% below the five-year average for this time of year. Distillate fuel inventories decreased by 4.5 million barrels last week and are about 11% below the five-year average for this time of year.
However, despite propane/propylene inventories falling by 1.1 million barrels from last week, they are 62% above the five-year average for this time of year.
Total commercial petroleum inventories decreased by 17.0 million barrels last week. Total products supplied over the last four-week period averaged 20.6 million barrels per day, up by 4.6% from the same period last year. Over the past four weeks, motor gasoline product supplied averaged 9.0 million barrels per day, up by 1.2% from the same period last year. Distillate fuel product supplied averaged 4.0 million barrels per day over the past four weeks, up by 4.8% from the same period last year. Jet fuel product supplied was down 4.6% compared with the same four-week period last year.
Currencies
On Wednesday, the US dollar strengthened against major currencies following the FOMC's decision to leave interest rates unchanged.
The FOMC's 8 – 4 vote represented its most divided outcome since 1992, highlighting the challenges that incoming Chair Kevin Warsh will encounter in advancing proposals for rate reductions. Current Chair Jerome Powell’s term as Chair ends on 15 May.
During a press conference, Chair Powell stated that although four officials dissented against maintaining an easing bias, he does not anticipate the Fed shifting toward interest rate increases.
The euro declined -0.34% to $1.1672, while the British pound fell -0.28% to $1.3472. Against the US dollar, the euro is +1.01% MTD and -0.62% YTD. The British pound is +1.90% against the US dollar MTD and -0.01% YTD.
The dollar index rose +0.33% to 98.95. The US dollar index is -0.92% MTD and +0.69% YTD.
Market participants are also closely monitoring upcoming decisions from other major central banks, including the ECB and the BoE today. On Wednesday, the BoC kept its key interest rate unchanged.
The Japanese yen weakened past ¥160 per dollar, closing +0.51% higher at ¥160.35 and approaching levels that previously prompted intervention. This occurred despite the BoJ indicating after its policy meeting on Tuesday that it may consider raising rates in the coming months. The yen is -1.05% MTD and -2.36% YTD.
Cryptocurrencies
Bitcoin +11.07% MTD and -13.60% YTD to $75,769.44
Ethereum +6.89% MTD and -24.61% YTD to $2,245.53
Bitcoin was -0.78% and Ethereum was -1.96% on Wednesday. Despite Wednesday’s drop, both Bitcoin and Ethereum have staged a strong recovery in April due to robust Spot Bitcoin and Spot Ethereum ETF flows. In addition, despite initial drops due to the war in Iran and the closure of the Strait of Hormuz, both Bitcoin and Ethereum have shown themselves to be "apolitical" risk assets, and therefore attractive to investors. Institutions have also continued to accumulate cryptocurrencies, particularly Bitcoin.
Note: As of 5:00 pm EDT 29 April 2026
Fixed Income
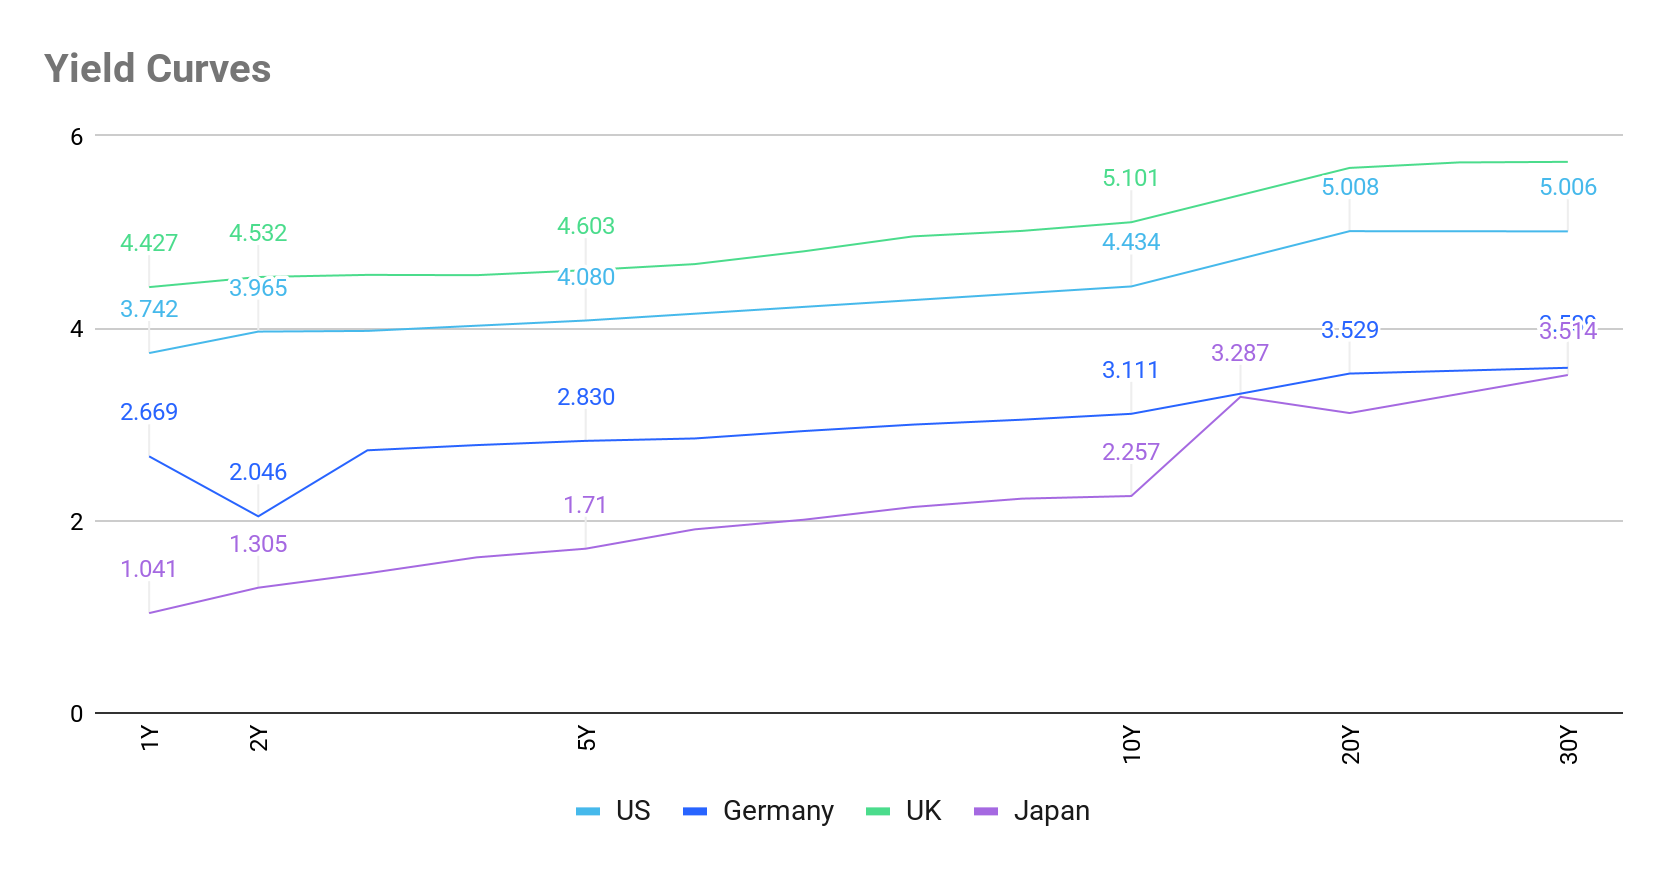
US 10-year yield +11.6 bps MTD +19.6 bps YTD to 4.434%
German 10-year yield +10.5 bps MTD +26.4 bps YTD to 3.111%
UK 10-year yield +24.5 bps MTD +57.1 bps YTD to 5.101%
US Treasury yields rose across the curve on Wednesday after the FOMC held interest rates steady, but in its most divided decision since 1992 noted rising concerns about inflation.
The 2-year note yield, which typically moves in step with Fed interest rate expectations, was up +11.5 bps on the day to 3.965%, the highest since 27 March.
The yield on US 10-year notes rose +8.1 bps to 4.434%, the highest since 30 March. On the long end of the maturity spectrum, the 30-year yield advanced +6.7 bps to 5.006%.
The yield curve bear flattened on Wednesday, with the spread between the two- and 10-year yields narrowing to 46.9 bps from 40.3 bps at the end of Tuesday’s session. Over the month, the US yield curve has flattened by 4.4 bps, with the spread between two- and 10-year yields at 46.9 bps on Wednesday from 51.3 bps at the end of March.
The yield on the US 10-year Treasury note is +11.6 bps MTD for April. The US 30-year yield is +9.2 bps. At the short end, the two-year Treasury yield is +16.0 bps MTD.
Current sentiment in the Fed funds futures market, according to CME's FedWatch Tool, suggests an 1.0% probability of rates decreasing to the 3.25 - 3.50% range at the June FOMC meeting, higher than the 0.0% implied probability one month ago, where the market assigned a 7.7% probability of rates rising to the 3.75 - 4.00% level.
Source: FactSet
In the UK the 10-year gilt +6.1 bps to 5.101% on Wednesday. On the short end, the 2-year gilt was +8.7 bps to 4.544%. The UK's 30-year gilt yield +3.2 bps to 5.731%. In the UK, the 10-year gilt yield is +24.5 bps MTD. The UK 30 year is +21.1 bps so far in April.
Across the channel, eurozone bond yields advanced to new multi-week highs on Wednesday, reflecting heightened market sensitivity ahead of key economic releases.
German inflation data published on Wednesday provided evidence for both optimistic and cautious perspectives. The report indicated an increase in headline inflation driven by higher energy prices, while core inflation, which excludes volatile components such as energy, declined.
The 10-year bund yield rose +3.7 bps to 3.111%. The yield on the rate-sensitive two-year note reached its highest levels since 7 April, climbing +11.1 bps to 2.752%. This marked the eighth consecutive day of increases, the longest streak since April 2023. At the long end of the German yield curve, the 30-year yield edged up +0.9 bps to 3.589%.
Italy’s 10-year yield advanced +5.9 bps to 3.941%, resulting in a spread of 83.0 bps between German and Italian 10-year yields.
The primary concern facing the ECB is whether rising energy prices will trigger a broader increase in prices across the eurozone. The central bank is expected to keep interest rates steady at today’s meeting, however, money markets are currently pricing in approximately three 25 bps rate hikes by year-end.
The German 10-year yield is +10.5 bps MTD for April. The spread between US 10-year Treasuries and German Bunds stands at 132.3 bps, reflecting an increase of 1.1 bps over the month so far, from 131.2 bps at the end of March.
The 2-year Schatz is +12.9 bps MTD and the German 30-year yield is +13.4 bps MTD.
France’s 10-year OAT yield was +3.7 bps MTD to 3.766%. The spread of French government bonds versus German Bunds has declined by 6.8 bps over the month to 65.5 bps, from 72.3 bps at the end of March.
During April the spread of Italian 10-year BTPs over Bunds has narrowed by 7.6 bps so far. The Italian 10-year BTP yield has increased by +2.9 bps MTD.
Note: As of 5:00 pm EDT 29 April 2025
What to think about in May 2026
The chokepoint premium: trade, supply shocks and central bank divergence. Trade disruptions have rarely felt this layered. At the centre of it all sits a simple, but uncomfortable truth: not every economy enters this supply shock with the same toolkit and the divergence in policy flexibility that flows from that is already starting to price into rates and FX markets.
The US carries what is effectively a built-in energy insurance policy via its shale production base. This domestically sourced crude and LNG that partially insulates the Fed from having to respond to energy-driven inflation with the same urgency as, the ECB or the BoE. China is not helpless either. It remains the world's largest oil importer, but its rapidly expanding renewables base, adding more solar capacity in the first half of 2025 alone than the entire installed US solar fleet, combined with its coal buffer, gives Beijing meaningful shock absorption of its own. The energy calculus for Europe and Japan is considerably more painful.
That divergence is starting to show up in central bank communication. The Fed has already flagged that tariff-driven goods inflation and energy price pressures from maritime chokepoints are not simply ‘transitory’. The BoJ, in its April quarterly outlook, sharply revised CPI inflation to 2.8% for fiscal 2026, up from 1.9%. At its meeting this week, three board members dissented in favour of a rate hike, the most hawkish split since 2016. With the ECB and BoE both expected to hold today, the policy tone will almost certainly echo a shared concern: supply-side shocks are emerging and they're not uniform.
What makes this cycle particularly thorny is where the disruption is already biting hardest. The Strait of Hormuz situation has effectively seized up fertiliser flows globally. The FAO projects fertiliser prices averaging 15 – 20% higher in H1 2026. Higher energy prices are simultaneously boosting biofuel demand, tightening the food-fuel tradeoff further. This is a supply-side shock with a long tail, one that feeds directly into core goods inflation and complicates the ‘look-through’ narrative that central banks would very much prefer to lean on.
For rates markets, the implication is higher-for-longer in the US and, increasingly, in Japan, while Europe faces a more uncomfortable blend of growth drag and inflation upside. For FX, the dollar's position is arguably strengthened not just by the rate differential, but by the underlying energy independence story. This is a structural argument that resonates with investors beyond the usual carry trade calculus. And yet US equities have kept climbing, with the S&P 500 up 9.30% so far this month after reaching all-time highs in mid-April, as earnings revisions in tech and financials have been robust enough to outweigh the macro noise. The market, for now, seems content to price in the insurance and look past the premium, but the agricultural supply chain story is one that deserves a closer watch before it becomes harder to dismiss.
Key events in May 2026
The potential policy and geopolitical risks for investors that could affect corporate earnings, stock market performance, currency valuations, sovereign and corporate bond markets and cryptocurrencies include:
27 April - 22 May The 2026 Review Conference of the Parties to the Treaty on the Non-Proliferation of Nuclear Weapons, New York. The 2026 Review will review the implementation of the Treaty from 2022 across its three pillars: nuclear disarmament, non‑proliferation and the peaceful uses of nuclear energy. The Conference will also seek to identify the areas and means through which further progress can be made.
29-31 May The IISS Shangri-La Dialogue Asia Security Summit, Singapore. Vietnam’s General Secretary and President To Lam will deliver the keynote address at this year’s summit. The summit will discuss the US strategy for peace in the region, the priorities in Asia’s shifting strategic landscape, Asia’s maritime security, cross-regional security threats and regional tensions, China’s cooperative partnerships and evolving security partnerships.
31 May Colombia Presidential election. In the first round of the presidential elections, despite a surge in guerrilla attacks by the Revolutionary Armed Forces of Colombia (Farc), the current president’s chosen candidate, the leftwing senator Iván Cepeda, who supports maintaining the 2016 peace programme with Farc, remains in the lead in polls with 44.3% of intended votes. However, rightwing candidates Abelardo de la Espriella and Paloma Valencia are slowly closing in with 21.5% and 19.8%, respectively. Much may change in the second round run-off, with Valencia, seen as more centrist, likely to take a higher percentage of the vote.
While every effort has been made to verify the accuracy of this information, EXT Ltd. (hereafter known as “EXANTE”) cannot accept any responsibility or liability for reliance by any person on this publication or any of the information, opinions, or conclusions contained in this publication. The findings and views expressed in this publication do not necessarily reflect the views of EXANTE. Any action taken upon the information contained in this publication is strictly at your own risk. EXANTE will not be liable for any loss or damage in connection with this publication.
本文提供给您仅供信息参考之用,不应被视为认购或销售此处提及任何投资或相关服务的优惠招揽或游说。金融工具交易存在重大亏损风险,未必适合所有投资者。过往表现并非未来业绩的可靠指标。


由专业人士创建。 为专业人士。
