

Alpha Vibes - When scarcity becomes opportunity



Renée Friedman, Global Head of Research

Horacio Coutino, Multi-asset Strategist
Demand is proven. The distribution of returns is not
A Q3 reassessment of the seven investable layers of AI
Since late September, every layer of our unique and comprehensive seven-layer AI framework, Fabrication Equipment & Process Materials, Memory and Storage, Compute and Silicon, Networking, Site-readiness and Physical Infrastructure, Power and Electrification, and, finally, Applications, has posted higher forward earnings estimates and lower share prices. The market is now focussed on balance-sheet velocity, pricing power and incremental return on invested capital.
- Growth and valuation have become increasingly disconnected. The Memory layer combines the framework’s strongest expected EBITDA growth with its lowest multiple and deepest price decline. Compute and Fabrication also offer substantial growth at lower valuations, but apparent cheapness must survive normalised pricing, additional capacity and higher financing costs.
- Cash conversion divides the architecture more sharply than earnings growth. Fabrication, Memory and Power have improved their FCF margins since September. Networking and Applications generate less cash despite higher EBITDA margins, while Site readiness remains cash-negative.
- Duration is priced over velocity. Contracted, recurring and regulated cash flows command a premium. Earnings tied to a handful of correlated hyperscaler budgets are capitalised as cycle, however strong their growth.
- The binding constraint has migrated to photonics, packaging and politics. Indium-phosphide (InP) lasers are sold out into 2029, hybrid-bonding and substrate capacity is tight and state-level grid permitting has become harder after the November midterms.
- Stock selection within layers now matters as much as allocation between them.
The AI buildout has never been more profitable, yet its profits have never been priced more cheaply. The sections that follow show where that discount is a warning and where it is an opportunity.
Key Takeaways
Q3 has narrowed the uncertainty around AI demand while widening the debate over its returns.
Rising earnings expectations and falling valuations have created meaningful dislocations, but neither growth nor scarcity is sufficient evidence of value.
• Velocity is the new source of excess returns. The ability to fund growth internally, through customer prepayments or high FCF conversion, has become the clearest competitive advantage in the stack. Low - margin integrators and heavy builders face the s harpest scrutiny. - CapEx
• Treat low multiples as a question, not a conclusion. Rising estimates against compressing multiples have created a valuation asymmetry, but a cheaper multiple is not proof of mispricing.
• Constituent selection now supersedes layer beta has created compelling asymmetry, but sharply divergent cash capacity across the seven layers warrants higher scrutiny.
How has the narrative shifted?
Behind an earnings acceleration lies a consequential allocation of risk
In September’s The new price of AI growth, we argued that operating evidence was replacing thematic conviction. The market was preoccupied with whether record hyperscaler CapEx was converting into tangible supplier revenue and early software monetisation. Eight weeks later, physical demand and top-line conversion are no longer in doubt. However, the financial architecture funding that growth is being actively repriced.
Q3 earnings season has forced a decisive evolution in our seven-layer AI taxonomy introduced in June’s The Architecture of Disruption. Q3 disclosures, higher real interest rates and term premia have shifted market focus from the scale of AI adoption to balance-sheet velocity, pricing power and incremental return on invested capital.
Cash conversion undermines any ‘better fundamentals, cheaper shares’ conclusion. Since September, Fabrication (the first layer or L1), Memory (L2) and Power (L6) have improved their FCF margins, whereas Networking (L4) and Applications (L7) convert less cash despite higher EBITDA margins. Opportunity is selective within layers.
Every layer upgrades, no layer escapes
Comparing consensus earnings per share (EPS) revisions for the next twelve months (NTM) with price action across all three editions of our framework, i.e., in June, September and now in mid-November after Q3 earnings, shows how the market’s pricing regime moved from thematic enthusiasm in H1 to valuation compression across H2.
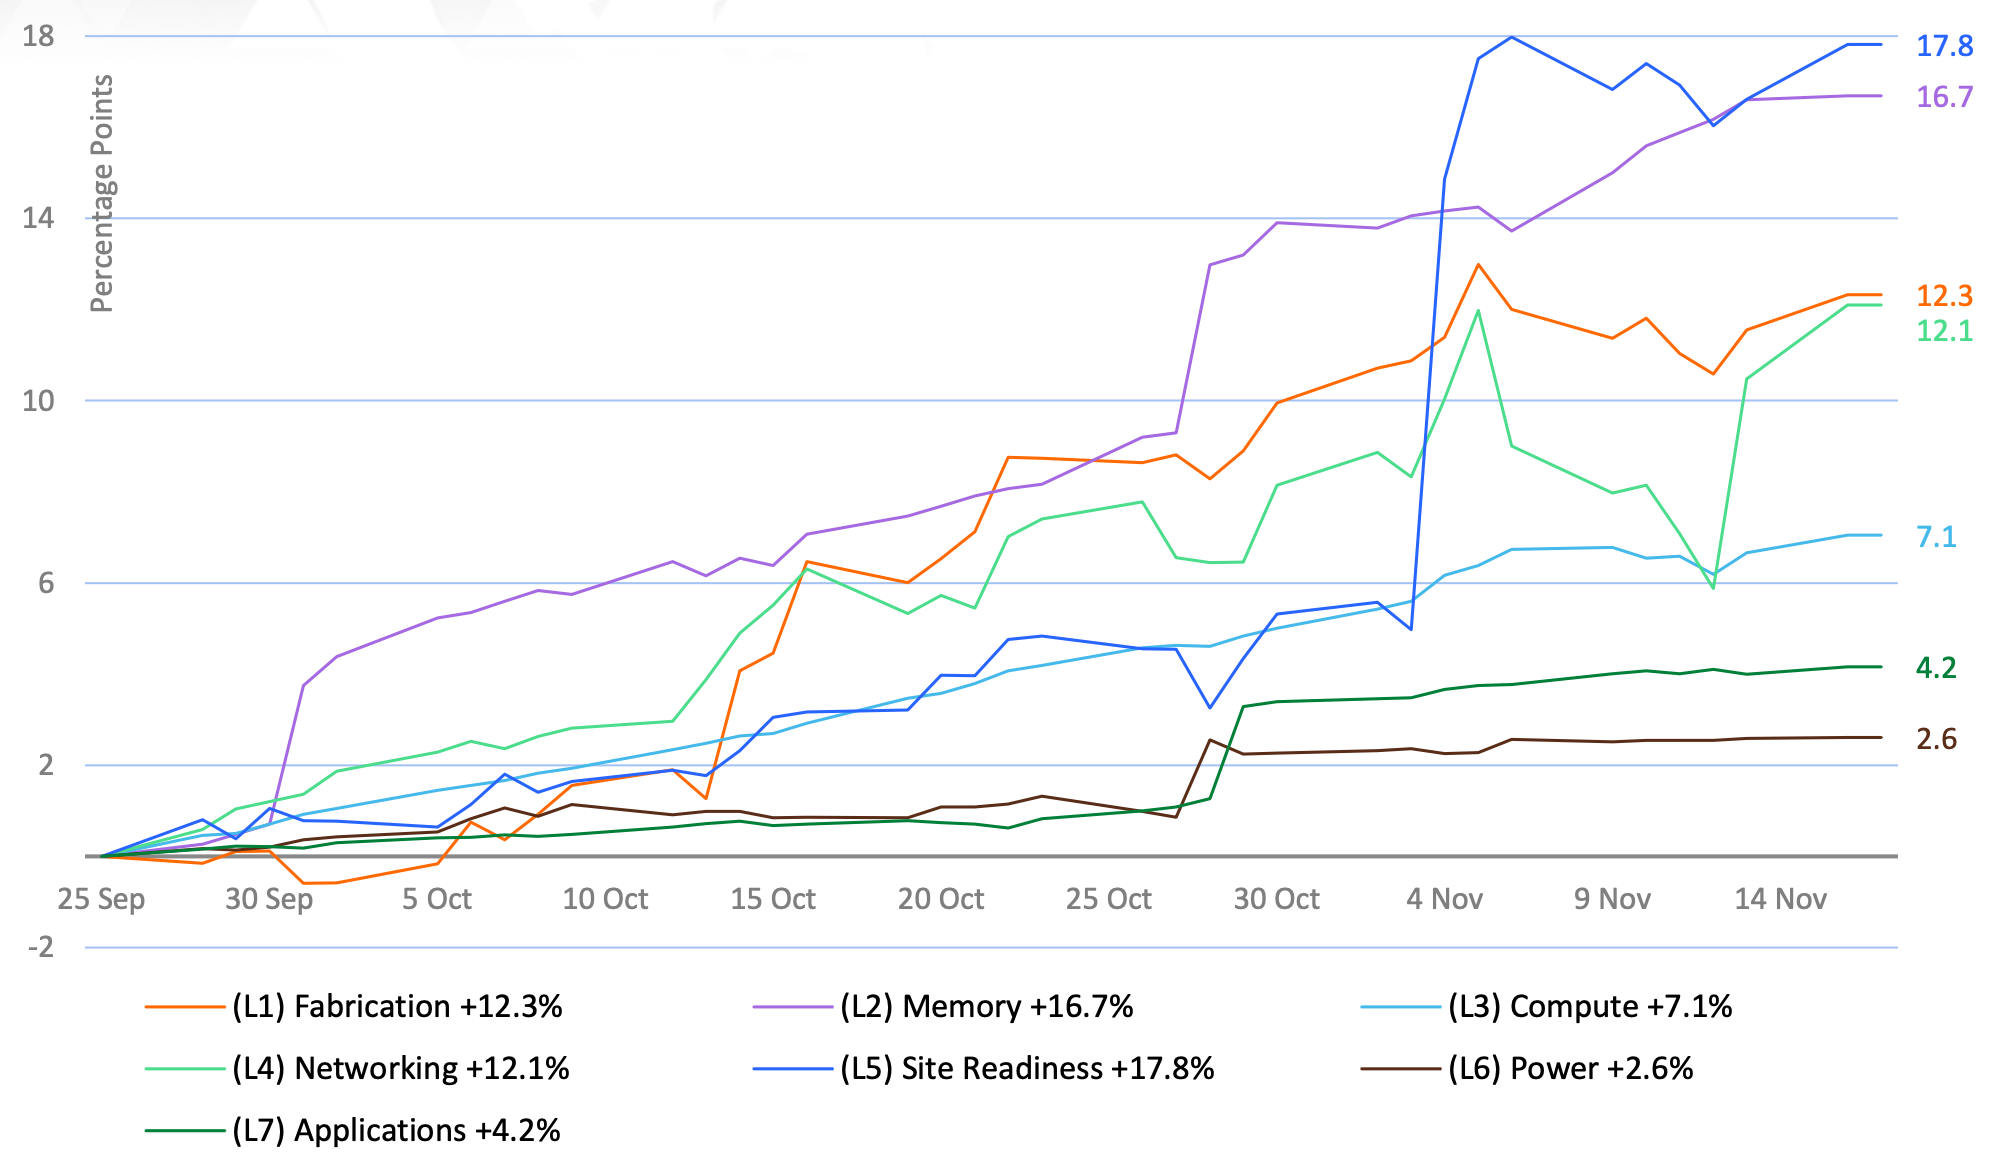
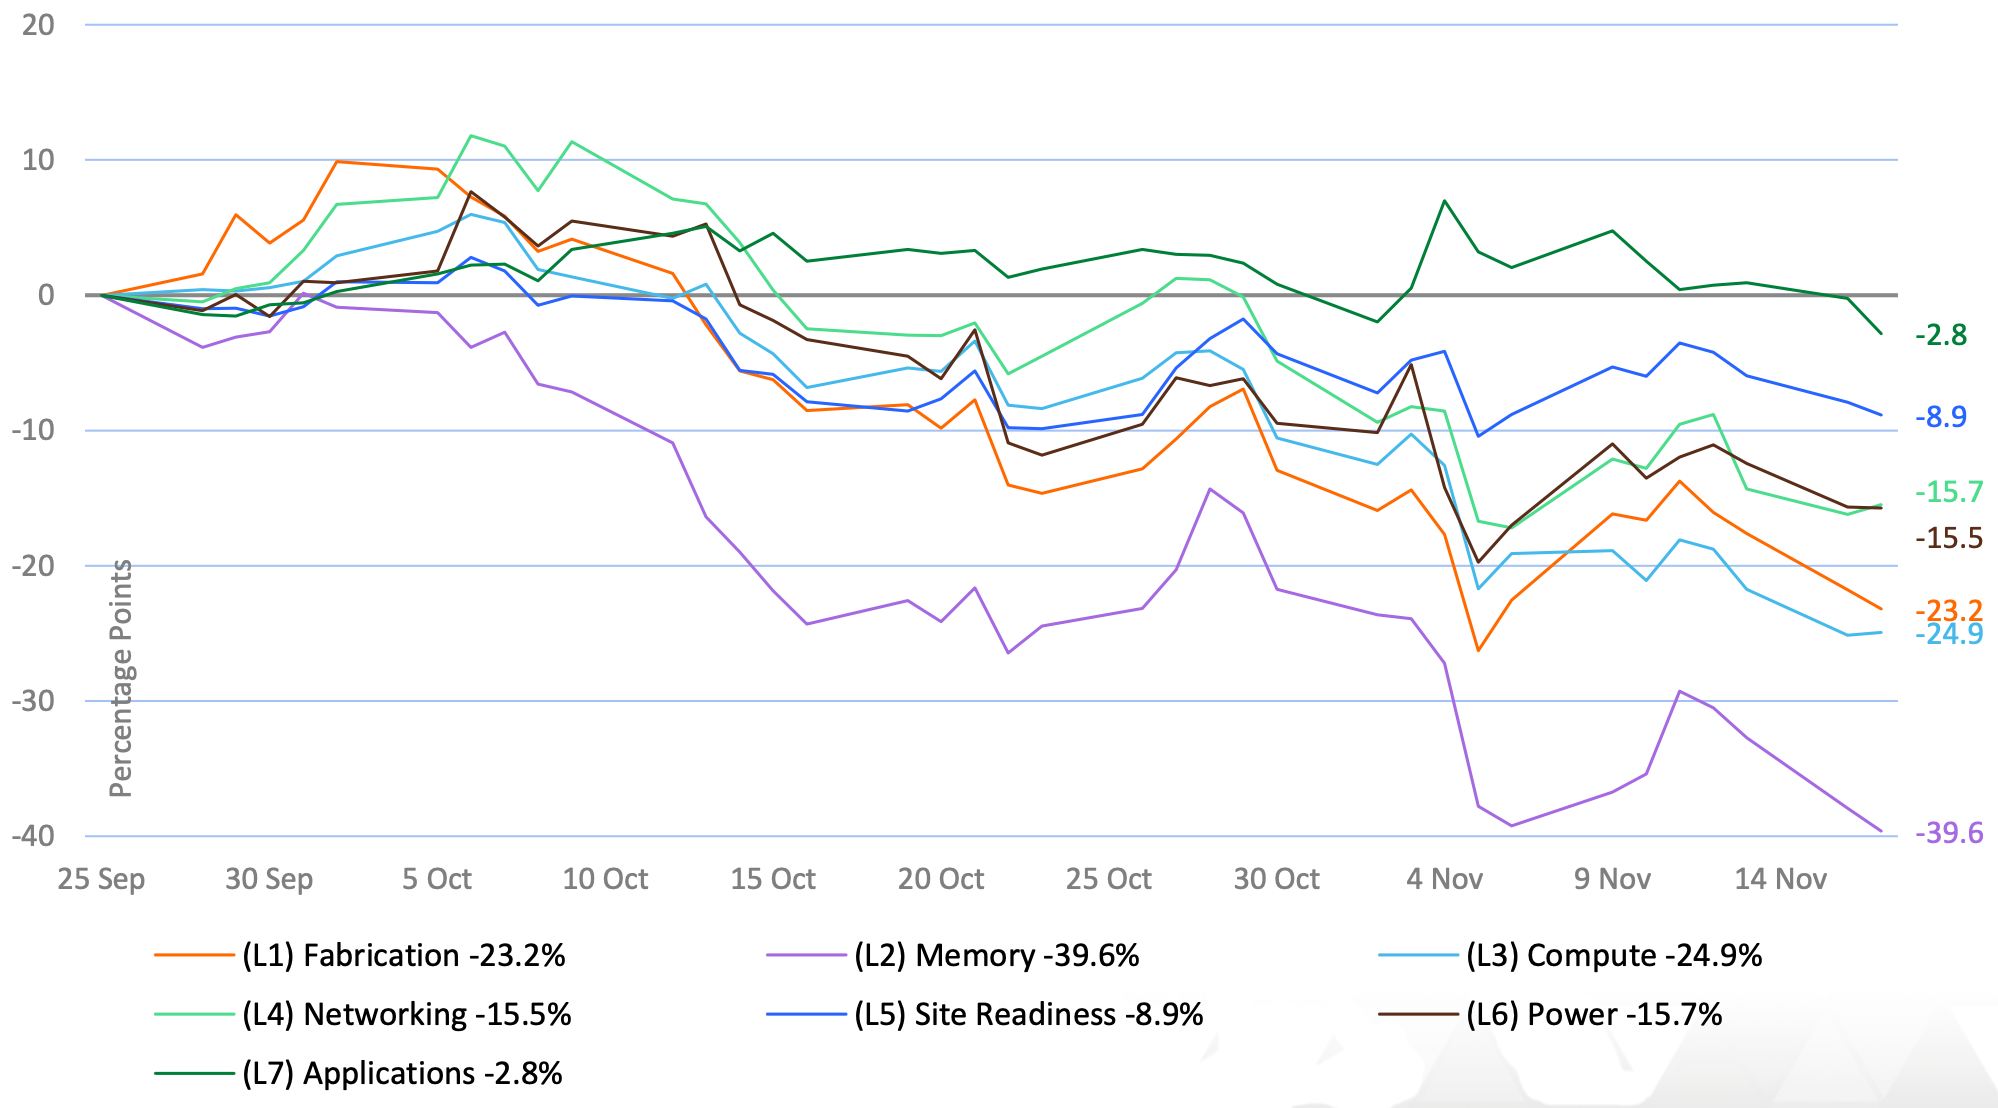
Since 25 September, the updated NTM EPS and price performance charts show that the inversion between rising earnings estimates and falling share prices is universal across all seven layers. Every layer posted positive NTM EPS revisions over the period, ranging from 2.6% to 17.8%, yet every layer recorded negative price performance over the same window, with declines ranging from 2.8% to 39.6%.
Growth revised higher, conviction priced lower (chart 1)
AI layers’ EPS NTM growth in percentage points since 25 September
Source: FactSet and EXANTE
Beat, raise and sell: the season’s pricing regime (chart 2)
AI layers’ price performance in percentage points since 25 September
Source: FactSet and EXANTE
Site-Readiness (L5) and Memory (L2) led the earnings revisions at opposite ends of the price spectrum. L5 posted the strongest NTM EPS revision since 25 September at 17.8 percentage points, jumping more than 12.0 points around 4 November after Vertiv raised full-year EPS guidance by 45 cents to $7.15, Super Micro Computer lifted its full-year 2026 revenue guide to $72 to $82 billion, and Equinix and Digital Realty raised full-year Adjusted Funds From Operations (AFFO)/Core Funds from Operations (FFO) guidance. Its 8.9% price decline was the second smallest in the complex, as strength in REITs and Vertiv offset the drop in Super Micro Computer shares after its print. Conversely, L2 had the second-largest revision at 16.7 percentage points, rising in two steps after Micron’s 30 September blowout and the October reports from SK Hynix and Sandisk. Yet, L2 fell furthest in the framework, down 39.6% after a 16.4% decline in the prior period, as the market refuses to assign a secular multiple to peak memory earnings.
Fabrication (L1) and Networking (L4) compounded their estimate upgrades amid a hardware de-rating. L1 added 12.3 percentage points to its NTM EPS estimates (after 28.1% between June and September) as ASML, Lam Research, Qnity, Entegris and Applied Materials all beat Q3 expectations and raised their 2027 Wafer Fab Equipment (WFE) outlooks. Even so, the basket fell 23.2% (close to its 25.6% decline in the prior period) as semi-cap multiples compressed amid mid-October financing jitters and the post-US midterm elections selloff. Networking (L4) almost doubled its pace of NTM EPS upgrades, from 6.6% between June and September to 12.1 percentage points since 25 September. EPS upgrades spiked after Arista Networks, Lumentum and Coherent all reported, but L4 constituents share prices fell 15.5% in aggregate since 25 September.
Compute (L3) absorbed the Nvidia governance compression, Power (L6) turned positive on earnings, and Applications (L7) proved most defensive. Ahead of Nvidia’s Q3 release, L3 gained 7.1 percentage points in NTM EPS since 25 September on AMD’s 2027 revenue growth guide and Broadcom’s AI targets of $115 billion for full-year 2027 and $230 billion for full-year 2028. Its price fell 24.9% (reversing a 4.9% gain in the prior period) as Nvidia slid 31.9% before its print after Jensen Huang’s resignation and Marvell dropped 36% on the $115 billion all-stock Lumentum deal. Crucially, Power (L6) reversed its 2.0% NTM EPS decline of June to September, adding 2.6 percentage points since 25 September (stepping higher on 28 October after GE Vernova’s beat and holding gains through Eaton, Vistra and Constellation Energy). Its price still fell 15.7% after the US midterm elections and Texas data-centre audit orders. Finally, Applications (L7) rose 4.2 percentage points in NTM EPS (jumping on 28 October after Microsoft and ServiceNow) and stayed positive on price for almost the entire six-week period, peaking near seven percent on 4 November, before finishing down only 2.8%. That made Applications the top-performing layer on price for a second consecutive edition.
The changing price of growth
A second, deeper de-rating
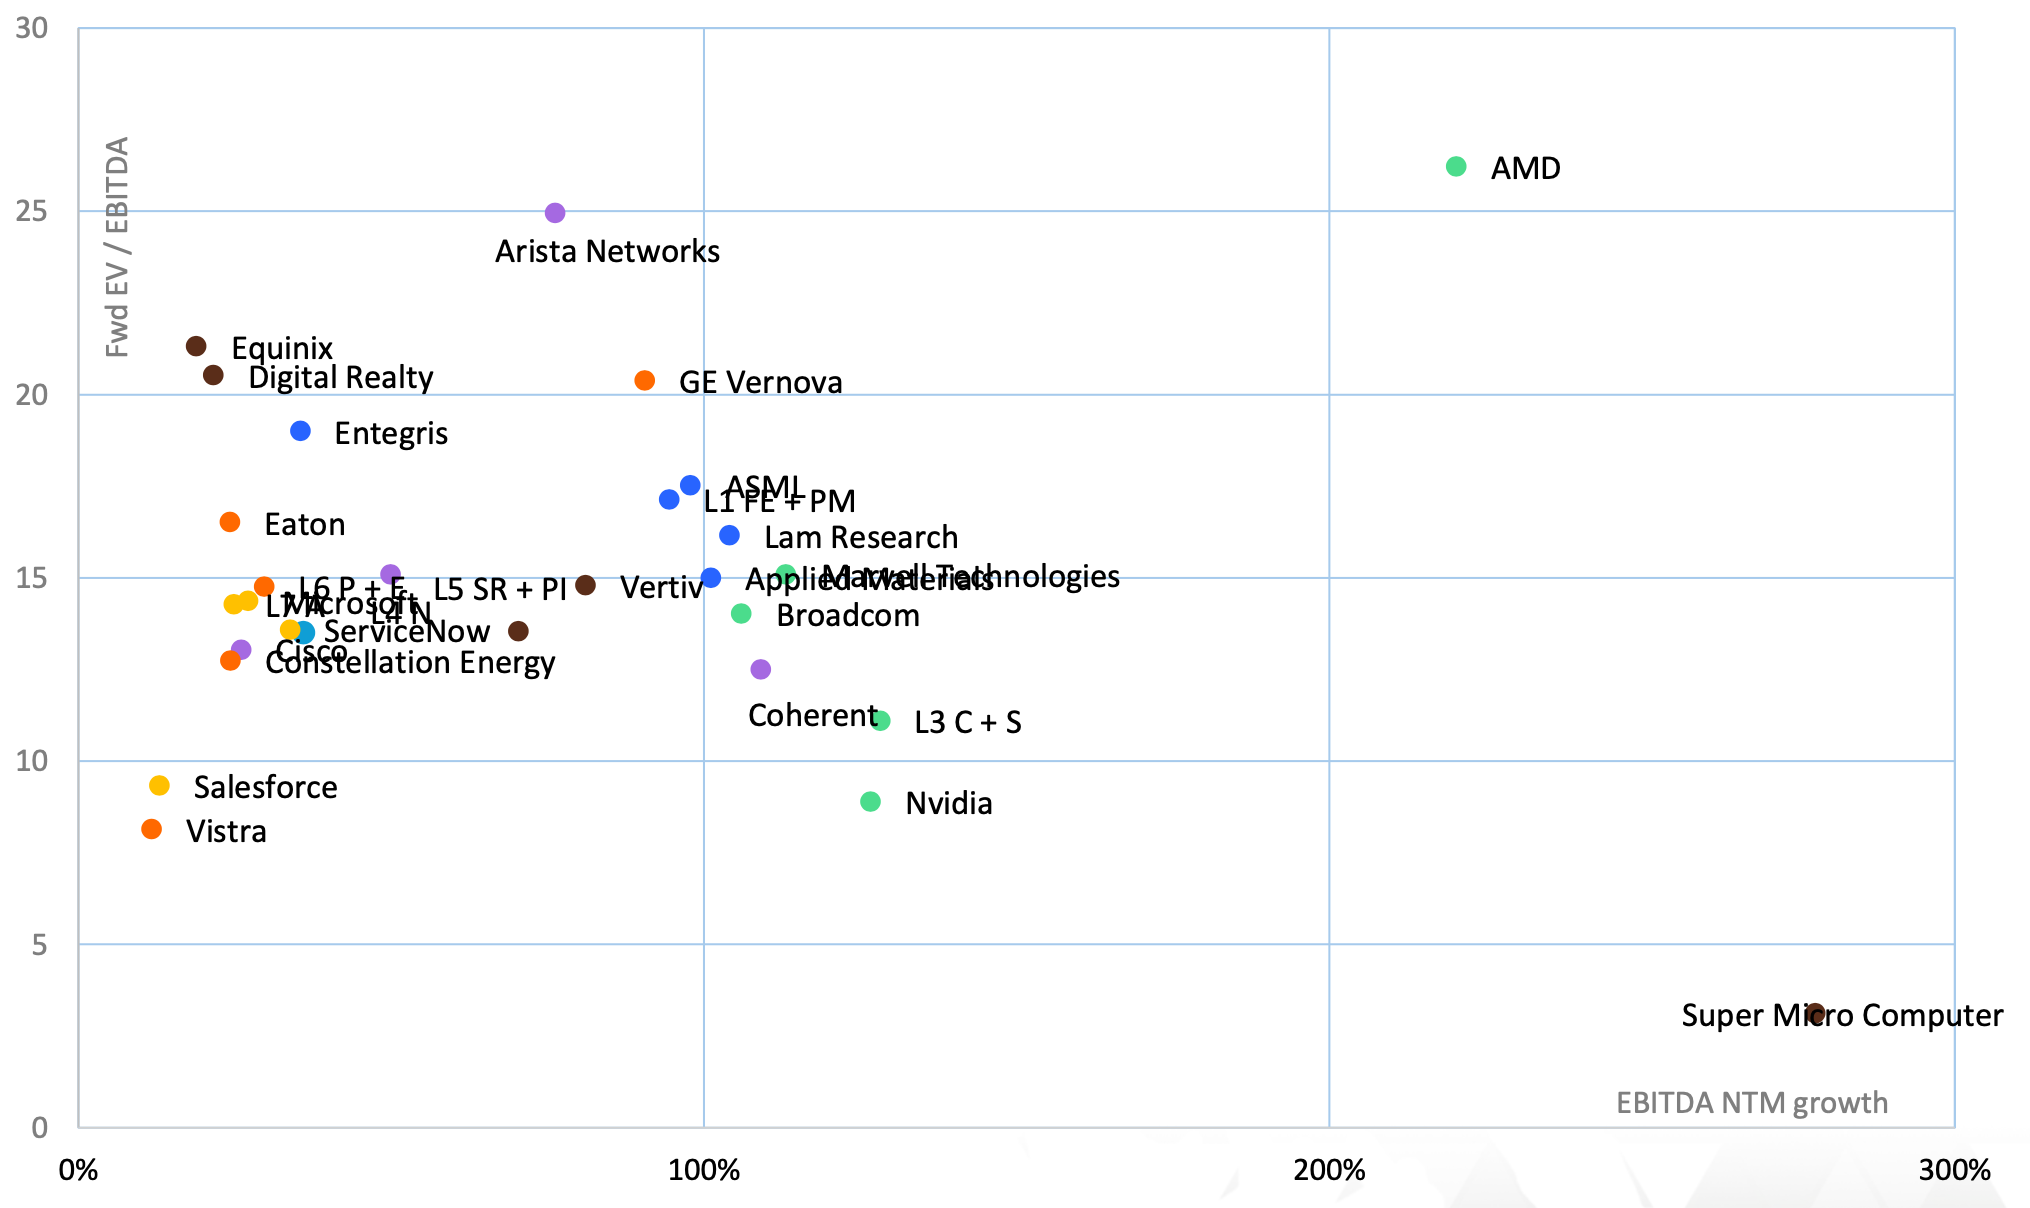
The scatter of forward EV/EBITDA against forward EBITDA growth, shown in Chart 3 below, reveals a second and deeper valuation compression and a changed shape. On the growth axis the layers now rank cleanly, yet multiples do not follow. Memory (L2) shows forward EBITDA growth of 592.5% on 2.3x, Compute (L3) 128.2% on 11.1x, Fabrication (L1) 94.4% on 17.1x, Site readiness (L5) 70.3% on 13.5x, Networking (L4) 49.9% on 15.1x, Power (L6)29.7% on 14.8x and Applications (L7) 24.9% on 14.3x. Measured as a natural Price/Earnings-to-Growth (PEG), investors pay about 0.6 turns of EBITDA per point of growth in Applications and 0.5 in Power, compared with 0.3 in Networking, 0.2 in Fabrication and Site readiness, 0.09 in Compute and almost nothing in Memory.
In June, the cloud extended towards 45.0x and carried a clear premium for growth. Today, excluding Memory, multiples span only 11.1x to 17.1x across a fivefold range of growth and the slope has turned negative.
Compute’s multiple has fallen to 11.1x from 16.1x in September and 18.4x in June. Fabrication has declined to 17.1x from 23.3x and Networking to 15.1x from 20.1x, while Applications held at 14.3x. The ceiling is now AMD at 26.2x for 220.3% growth, followed by Arista Networks at 25.0x for 76.2%, compared with Arista Networks at 32.2x in September. Valuation compression has also reached the anchor of the theme. Before its Q3 print, Nvidia traded at 8.9x for 126.7% growth, against Microsoft at 14.4x for 27.1%, a growth adjusted discount of more than seven to one. Applied Materials at 15.0x, Lam Research at 16.2x and ASML at 17.5x, all near one hundred percent growth, sit between five and seven turns below September. Memory constituents trade between 1.5x and 3.0x on growth of 454.6% to 1,202.1%, joined by Super Micro Computer at 3.1x for 277.7%. Only the REITs held their multiples, near ~21.0x.
The updated plot, therefore, strengthens the evidence of growth–valuation dislocation and also makes comparison-base sensitivity central.
The price of growth (chart 3)
AI seven layers’ Forward EV/EBITDA and EBITDA NTM growth
Source: FactSet and EXANTE
Cash conversion separates scarcity from its cost
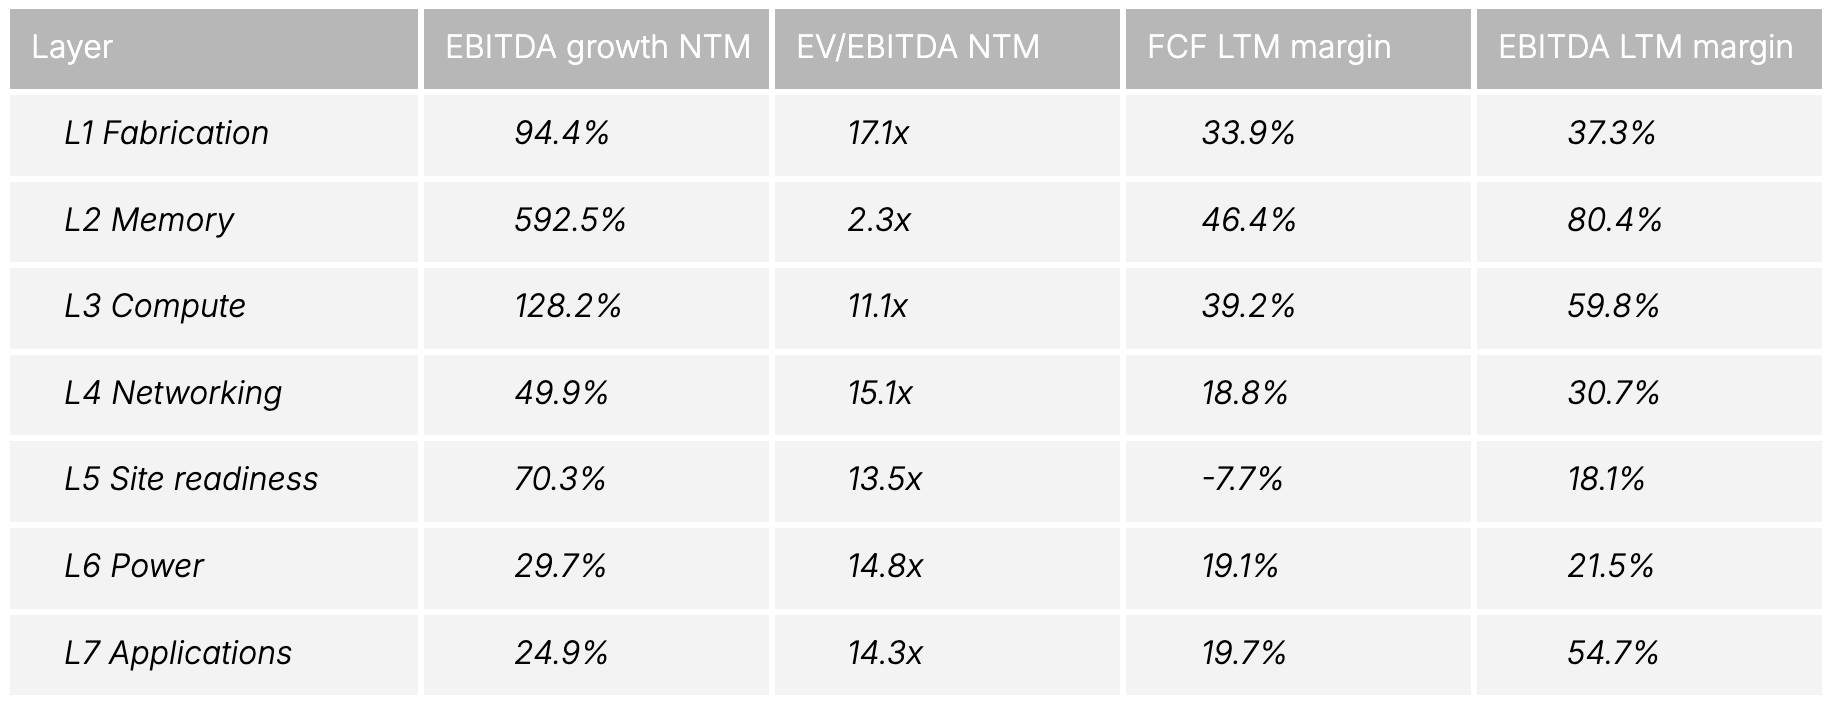
FCF and EBITDA margins help explain why multiples fell while earnings rose. Against our 251September readings, last twelve months (LTM) EBITDA margins expanded in five layers and held steady in two. Memory led at 80.4%, up from 74.7% in September and 51.7% a year earlier, with Sandisk adding 10.9 points in a quarter to reach 73.2%. Fabrication rose to 37.3% from 35.6%, Power to 21.5% and Networking to 30.7%, while Compute and Site-readiness were relatively flat.
FCF margins are more discriminating. Dividing each layer’s FCF margin by its EBITDA margin gives a simple conversion ratio. Fabrication now converts 90.8% of EBITDA into FCF, up from 63.8% in September, as ASML’s FCF margin rose to 53.0% from 27.5% on customers paying ahead for scarce lithography. Power converts 88.8%, up from 81.1%, as GE Vernova’s margin climbed to 38.9% from 30.1% on slot-reservation down payments. Memory converts 57.7% and Compute 65.6%, although AMD’s FCF margin fell to 15.5% from 20.3% on its inventory build. Networking slipped to 61.1% from 68.0% as Coherent fell to -23.2% from -14.4% and Arista Networks to 42.2% from 48.9%. Applications convert just 36.0%, with Microsoft’s FCF margin down to 17.3%, and Site-readiness remains negative, with Digital Realty at -20.5% from -7.4% as development CapEx accelerates.
The market did not reward conversion in a straight line. Fabrication and Power, the best converters, fell 23.2% and 15.7%, while Applications fell least. Customer prepayments at record margins look like late-cycle evidence because they front-load cash and bring forward the point at which orders normalise. That is why Memory’s 80% EBITDA margin is capitalised at barely 2x to 3x. With a 10-year US Treasury yield above five percent, balance-sheet velocity, the speed at which revenue becomes cash, is priced for its durability rather than its level. The FCF overlay shows who funds the buildout, while the multiple may reveal how long investors believe that arrangement will last.
Source: FactSet and EXANTE
What the Q3 season revealed, layer by layer
Fabrication Materials & Process Materials (L1)
Process intensity outruns wafer starts
Q3 results from all five constituents confirmed that three simultaneous shifts are raising deposition, etch, planarisation and metrology intensity much faster than wafer starts. These shifts are Gate All Around nanosheet transistors, backside power delivery and 3D High Bandwidth Memory (HBM) stacking.
TSMC’s Q3 revenue beat of $46.720 billion and its Q4 guidance validated this signal and Applied Materials provided the clearest confirmation. Its Q3 revenue of $10.409 billion and EPS of $4.16 both beat consensus. Semiconductor Systems generated $7.996 billion at a 39.0% operating margin, with Dynamic Random-Access Memory (DRAM) at 33.0% of Systems sales, while Applied Global Services contributed $1.896 billion at a 30.5% margin. Q4 guidance of $11.1 billion revenue and $4.35 EPS extended the signal beyond the beat.
ASML’s €11.662 billion in sales and its Q4 outlook of €14.2 billion to €15.2 billion, with capacity constrained through 2028, reinforced manufacturing intensity. Lam Research’s $8.22 billion revenue and its $8.6 billion outlook, limited by supply, showed that strong demand does not guarantee immediate shipments. Qnity’s revenue growth of 19.7% y/o/y corroborated demand for consumables and packaging materials across Semiconductor Technologies and Interconnect Solutions.
The layer’s 94.4% forward EBITDA growth at 17.1x now rests on a 37.3% EBITDA margin and a 33.9% FCF margin, up from 35.6% and 22.7% in September. However, the improvement is uneven. ASML’s FCF margin exceeding its EBITDA margin points to advances and timing, not a trend to extrapolate. The tollbooth thesis works best when collecting the toll does not mean financing the road.
Memory and Storage (L2)
Scarcity under contract, priced as a cycle
Memory shows the framework’s widest gap between growth and valuation, with 592.5% forward EBITDA growth priced at 2.3x despite a 39.6% price decline. Its latest LTM EBITDA margin has reached 80.4% and its FCF margin 46.4%, up from 74.7% and 41.8% in September. This is firmer operating evidence rather than a forecast recovery. The debate has shifted from the durability of prices to the terms of contracts.
September’s structurally constrained upcycle has become scarcity under contract. Micron pairs 650.2% expected EBITDA growth with a 3.0x valuation and a 44.3% FCF margin, up from 29.0% in September. SK Hynix offers 454.6% growth at 1.5x, yet its FCF margin slipped from 48.5% to 45.9% despite higher EBITDA profitability. Sandisk’s 1,202.1% growth at 2.7x comes with a 59.9% FCF margin and a 73.2% EBITDA margin. Such extraordinary growth rates call for scrutiny of their comparison bases rather than mechanical extrapolation.
The three businesses monetise different constraints. Micron and SK Hynix rely on HBM qualification, yields and DRAM allocation, while Sandisk relies on enterprise Solid-State Drives (SSDs), NAND pricing and node efficiency. The Earnings Scoreboards’ long-term supply agreements improve visibility, but do not remove capacity-cycle risk. Therefore, investors should stress-test normalised EBITDA, contractual pricing and capacity additions. The opportunity set depends on how far normalisation has been deferred and what must be reinvested before it arrives. Within this layer, the signals to watch are the cadence of new capacity, customers’ tolerance for pass-through and price bands and prepayment clauses.
Compute and Silicon (L3)
A wider perimeter around a de-rated anchor
The anchor held without its architect and the perimeter widened. AMD reported record revenue of $13.377 billion, up 44.7% y/o/y and EPS of $2.09 against $1.95 expected, with Data Centre revenue up 98.7% y/o/y to $8.460 billion. AI accelerator revenue will overtake server CPUs in Q4 as MI450 GPUs and Helios racks ramp at Microsoft, Meta, OpenAI and Anthropic. This supports a $17 billion Q4 guide, above the $16.294 billion consensus, and 2027 growth above 80%.
In custom silicon, Broadcom has established XPUs as a co-equal pillar of AI compute, with Alphabet now selling TPU systems to third parties, while Marvell’s agreed $115 billion acquisition of L4 constituent Lumentum would bring optics into custom compute. Broadcom and Marvell report in December and Broadcom is targeting more than $100 billion of AI revenue in 2027. L3 Q3 prints demonstrated hyperscaler silicon diversification across merchant alternatives and custom Application-Specific Integrated Circuits (ASICs) is accelerating rapidly while decoupling from client PC weakness.
Networking (L4)
Strategic scarcity, expensive expansion
L4 Q3 results demonstrated that as clusters scale past 100,000 accelerators and copper links hit physical limits at 200G per lane and 1.6T, networking value accrues to software-defined switching and bottlenecked optical laser components. In photonics, scarcity reached historic extremes. Lumentum disclosed that its AI optical capacity is sold out into early 2029 and that ~70% of demand for select InP laser components remains unmet through 2027
The conversion question we posed in September is being answered, at a cost to margin. Arista grew revenue 58.5% to $3.658 billion, the fastest since its IPO, at a 49.1% operating margin as hyperscalers move from InfiniBand to open Ethernet, and raised 2026 guidance to $13.3 billion.
Optics extends both opportunity and funding demands. Lumentum guided following-quarter sales to $1.575–$1.625 billion; Coherent projected fiscal 2027 pro forma growth above 60%, but quarterly CapEx of $776 million accompanied an $868 million FCF outflow. Lasers, indium phosphide, 1.6T transceivers and co-packaged optics are strategic constraints whose expansion remains expensive.
Site-readiness and Physical Infrastructure (L5)
Full order books, a working-capital test
September’s full-on orders, mixed on revenue timing has become a working-capital test. Vertiv’s net sales rose 61.2% to $4.313 billion and organic orders more than doubled, lifting full-year guidance to $14.65 billion of sales and $2.7 billion of FCF. Super Micro Computer was the counter-case. Its revenue nearly quadrupled to $19.945 billion and fiscal 2027 guidance rose to $72 to $82 billion. However, a 12.8% gross margin could not fund $5.7 billion of inventory and receivables growth, leaving operating cash flow at -$434 million. Equinix’s gross bookings rose 35% to $533 million and it raised AFFO-per-share guidance for a third time, to $43.71–44.11. Digital Realty signed a record $855 million of bookings and lifted core FFO guidance to $8.30–8.35.
In this layer, investors should assess AFFO, stabilised yields, development versus maintenance CapEx, leverage and energisation dates. A landlord’s construction programme and an integrator’s inventory build deserve different diagnostic labels.
Power and Electrification (L6)
Contracted power meets political power
Scarcity was monetised in Q3, and politics is now the binding risk. GE Vernova posted EPS of $4.81 on revenue up 26.8% to $12.64 billion, reached its $200 billion backlog milestone ahead of target and raised revenue guidance to $46.5 to $47.5 billion. Constellation reported EPS of $5.06 against $3.90 expected, with a 435 bps EBITDA margin expansion and the Crane restart on track for H2 2027. Vistra’s EBITDA rose 50.9% to $2.360 billion, and its 2027 EBITDA guidance of $7.7 to $8.5 billion is about 98% hedged. Eaton delivered record sales of $8.9 billion, up 19.0% y/o/y organically, with electrical backlog up 46.0%.
BlackRock’s Investment Institute noted that the 3 November Democratic sweep of the US House and Senate, together with 41 local ballot initiatives restricting data centres and Texas Governor-elect Gina Hinojosa’s call for a pause and audit on new data-centre approvals in a state that represents 30% of the 2028 US pipeline, has shifted investor scrutiny towards permitting timelines. It consequently trimmed its 2028 ex-China data-centre capacity forecast from about 66 GW to about 62 GW, even as Big-Three cloud revenue growth accelerated from 48% in Q2 to 56% in Q3.
Applications (L7)
Monetisation with different capital requirements
L7 was the most resilient basket on share price. This confirmed that enterprise AI adoption is moving from experimentation to billable recurring contracts that can partly underwrite upstream infrastructure CapEx.
Microsoft stood apart as the only Big-Four hyperscaler funding its AI buildout entirely from internal operating cash flow. Azure accelerated 48.0% in constant currency, while management trimmed 2026 CapEx to about $170 billion amid third-party delivery delays.
ServiceNow’s subscription growth and Remaining Performance Obligation (RPO) expansion were driven by a 135% jump in net new ACV deals above $5 million. Management therefore raised its 2026 Now Assist AI Annual Contract Value (ACV) target for the second time, to $1.7 billion, more than 70% above the initial annual target.
Salesforce anchored the shift from per-seat SaaS to outcome-based agentic pricing. Its RPO accelerated to a four-year high, up 14% in constant currency to $33.5 billion, as Agentforce Annual Recurring Revenue (ARR) surged more than 240% y/o/y past $1.5 billion within a $3.9 billion AI and Data 360 ARR base. Model Context Protocol calls jumped 6x q/o/q, 9 of the top 10 AI labs standardised on the platform and a $5.6 billion US Army contract lifted full-year 2027 guidance.
Conclusions for portfolio positioning
Velocity, duration and dispersion now set the price of AI exposure
Cash-flow velocity is the primary alpha vector. As hyperscalers commit more of their operating cash generation to infrastructure and increasingly access external financing, the ability to fund growth internally becomes a competitive advantage throughout the AI buildout. Pricing power belongs to monopolies and oligopolies that collect customer prepayments or convert EBITDA into FCF without balance-sheet friction. Low-margin integrators and heavy CapEx builders face severe balance-sheet scrutiny.
Duration adds a further layer of complexity to market pricing. The negative growth to multiple slope rewards contracted, recurring or regulated cash flows, from Microsoft’s enterprise base to Constellation’s long-dated Power Purchase Agreements (PPAs) and the REITs’ leases, and discounts earnings that depend on a handful of correlated hyperscaler budgets. That premium is itself a risk. Applications convert only 36% of EBITDA into FCF. Meta and Alphabet have shown how quickly the market withdraws a duration premium when CapEx outruns visible returns. What matters is tenor and price certainty. A 20-year PPA at contracted prices is capitalised as duration, whereas a five-year memory agreement that reprices within bands is capitalised as cycle.
Universal multiple compression against rising NTM EPS has created generational valuation asymmetry. Across all seven layers, forward earnings estimates have risen while share prices have declined. The extreme valuation premiums evident earlier in the year have compressed considerably, creating opportunities to acquire stronger expected earnings streams at materially lower multiples. However, a cheaper multiple is not sufficient evidence of mispricing. The investment case holds only if the estimates remain valid under normalised pricing, increased supply, higher financing costs and deployment delays. Positioning should follow the resilience of those drivers, not simply the magnitude of the drawdown.
The marginal constraint on AI growth has migrated to photonics, packaging and politics. Silicon design is executing ahead of schedule, as Vera Rubin’s one-month hyperscaler deployment time and Broadcom’s 2027 AI target demonstrate. Revenue recognition in 2027 through 2028 is now limited by physical and regulatory constraints, namely 6 inch Indium Phosphide laser wafers (sold out into 2029), 3D hybrid bonding and substrate capacity and grid permitting at the state level after the November midterms. Optical suppliers, packaging specialists and electrical-infrastructure providers warrant closer attention.
Dispersion within layers now rivals dispersion across layers. Owning a thematic basket is no longer sufficient. Arista and Coherent illustrate different cash-flow profiles within Networking; Vertiv and Super Micro Computer reveal contrasting economics within Site-Readiness. In Applications, Salesforce and ServiceNow differ materially from Microsoft’s infrastructure-intensive reinvestment model. The seven layer architecture is still an essential framework of the AI theme because it shows where scarcity turns into FCF and at what balance sheet price.
Este artículo se presenta a modo informativo únicamente y no debe ser considerado una oferta ni solicitud de oferta para comprar ni vender inversión alguna ni los servicios relaciones a los que se pueda haber hecho referencia aquí. Operar con instrumentos financieros implica un riesgo significativo de pérdida y puede no ser adecuado para todos los inversores. Los resultados pasados no garantizan rendimientos futuros. Los sentimientos se generan automáticamente y no constituyen un consejo de inversión.
 Volver a todas las perspectivas




Regístrese para recibir perspectivas de los mercados
Regístrese
para recibir perspectivas
de los mercados
Suscríbase ahora Suscríbase ahora



Creado por profesionales. Para profesionales.
