

September Equity Review - When CapEx crowds the curve


Executive Summary
What happened in September
US Equities performance
European Equities Performance
Q3 Earnings Preview
S&P earnings estimate revisions: what’s changed and where
Changing revenue expectations: who will lead
S&P 500 Earnings Growth rate projections for Q3
Projected Q3 2026 S&P 500 Net Profit margin: winners and losers
Earnings Forecasts for the coming quarters
Which sectors are sell-side analysts most bullish and bearish about now?
What to consider next

Horacio Coutino, Multi-asset Strategist
“My funds are yielding 7-plus percent with a three-year duration. I’ve waited for four decades for the ability to do that”.
Rick Rieder, Blackrock CIO, Global Fixed Income, speaking to The Wall Street Journal, 27 September 2026
Executive Summary
September tested the equity rally as higher sovereign yields, firmer inflation expectations and policy uncertainty forced investors to distinguish between earnings resilience and duration sensitivity.
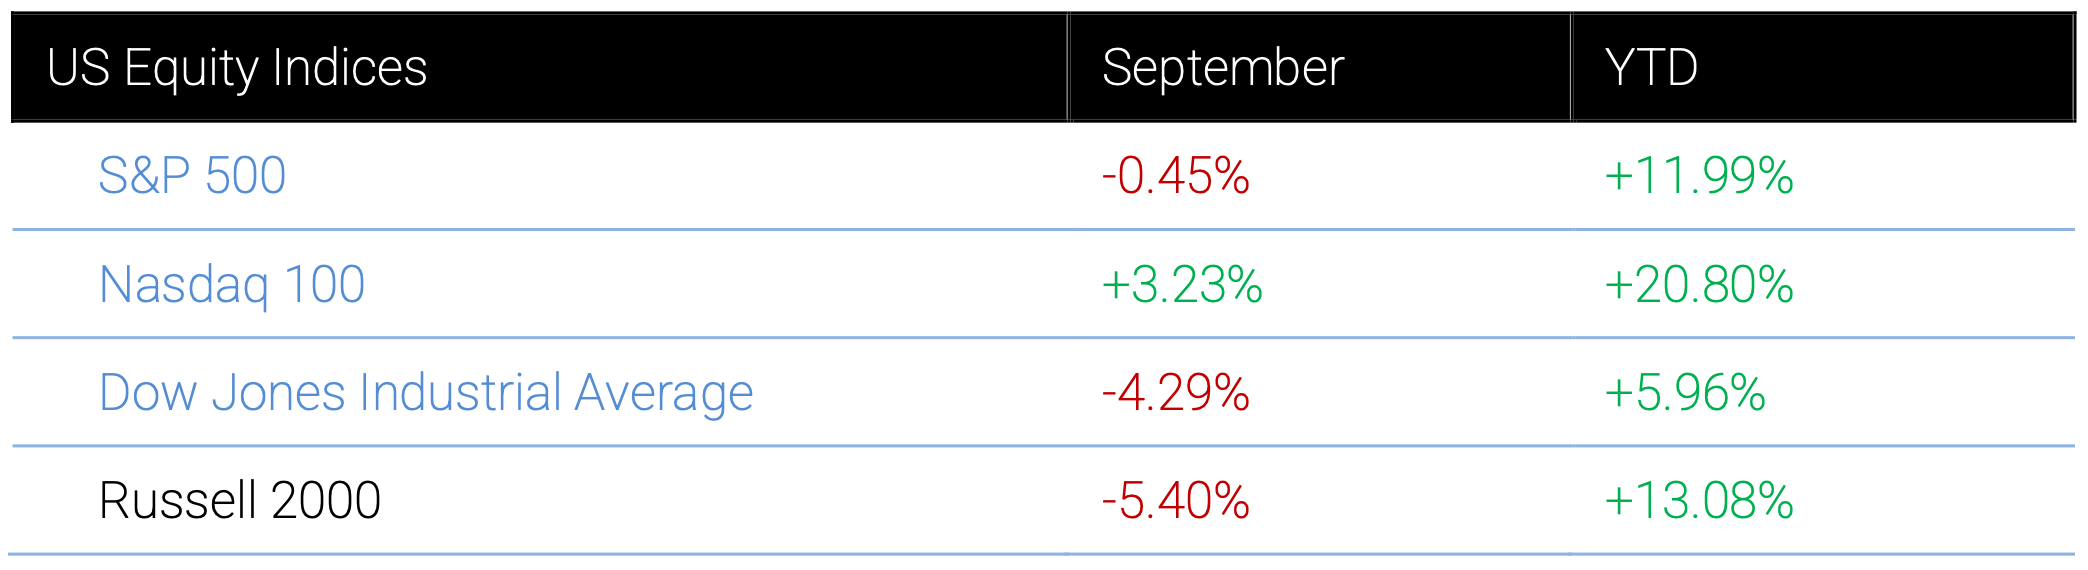
US benchmarks diverged sharply: the S&P 500 was -0.45%, while the Nasdaq 100 was +3.23%. Nine of the eleven S&P 500 sectors fell. The equal-weighted index underperformed by 5.44 percentage points. Leadership narrowed decisively around Information Technology and Communication Services. The Dow Jones Industrial Average and Russell 2000 fell 4.29% and 5.40%, respectively.
Europe offered little succour. The STOXX Europe 600 was -2.49%. It had its first monthly decline in six months, with fifteen of seventeen sectors down. The DAX and CAC 40 were the weakest performers. Technology and Oil & Gas were the principal pockets of resilience.
However, the earnings backdrop remained constructive on both sides of the Atlantic. Q3 S&P 500 profit expectations were revised higher, supported by Energy, Technology and Financials, with positive corporate guidance above historical norms. European earnings expectations also point to y/o/y expansion, although performance remains uneven across sectors and countries.
This review provides:
• A summary of US and European markets September performance
• A Q3 Earnings preview
• S&P 500 earnings estimate revisions
• Q3 revenue expectations
• Q3 S&P Earnings growth rate projections
• Projected Q3 S&P 500 Net profit
• Earnings forecasts for the coming quarters
• A look at where analysts are most bullish and bearish
• What to consider next
What happened in September
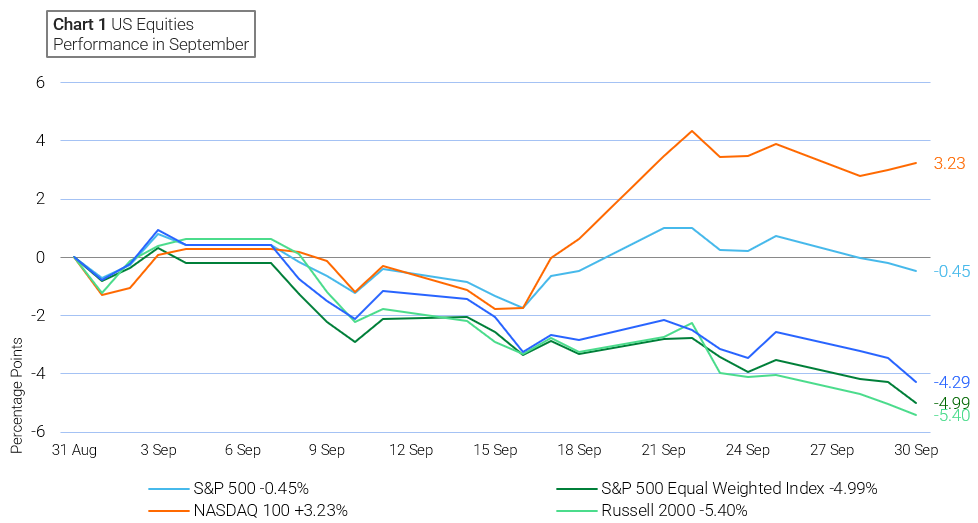
September marked a sharp reversal and a clear deterioration in market breadth. The S&P 500 outperformed its equal weight counterpart in 15 sessions, or 72.7% of trading days. This was the highest proportion since June 2025’s 75.0%. The market capitalisation weighted index exceeded the equal weight index by 5.44%. This was the widest margin since March 2020’s 6.29% difference. New 52-week highs exceeded lows in only two sessions, on 2 and 3 September. By 30 September, only 22.0% of S&P 500 constituents were trading above their 50-day moving average, the lowest share since March 2026. The lowest proportion of constituents since March 2025, 39.8%, were above their 200-day moving average.
The equal-weighted version of the S&P 500 was -4.99% and underperformed the benchmark by 4.54 percentage points in September, declining 4.99% compared with the S&P 500’s 0.45% decline. The equal-weighted version now trails the benchmark by 2.89 percentage points year-to-date.
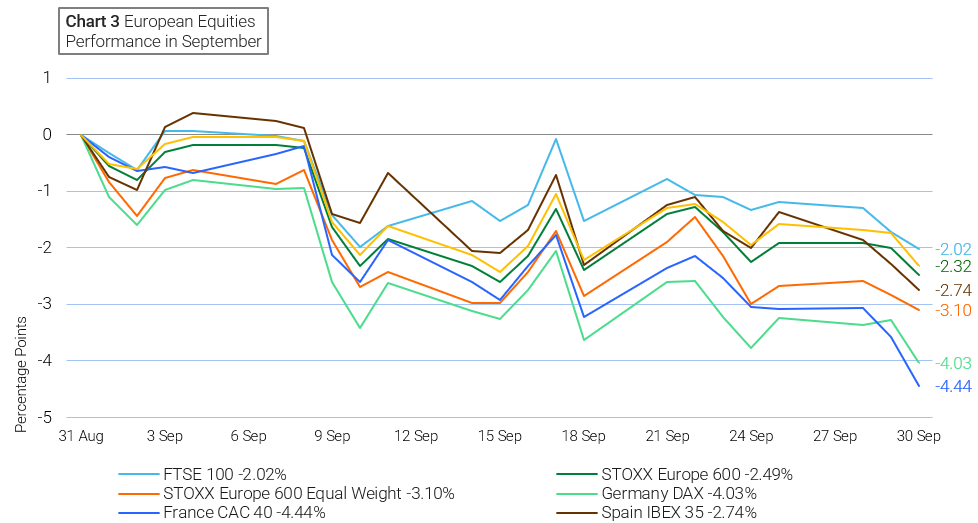
The Stoxx Europe 600 Equal Weight (EW) index declined 3.10%, underperforming the standard Stoxx Europe 600 by 0.61 percentage points. This relative weakness points to a broader sensitivity to expectations of tighter monetary policy and the reverberations of higher inflation expectations across sectors. Furthermore, the Stoxx Europe 600 recorded its first monthly loss in six months after hitting a record high in August.
US Equities performance
Note: FactSet. As of 5pm EDT 1 October 2026
A review of the past five years (60 months) reveals that the September performance across three of the four major US stock indices was subpar. Indices with greater exposure to Technology stocks, such as the Nasdaq Composite and Nasdaq 100, ended the month in positive territory. The Russell 2000 and the Dow Jones Industrials Average delivered results below the 20th percentile. The Nasdaq 100 performed best. Its +3.23 % performance positioned it at its 61.0th percentile of the past 60-month performance distribution. It was the only major index to a performance above its median monthly performance.
The S&P 500 fell 0.45 %, ranking it at the 35.5th percentile. The Russell 2000’s loss of 5.40 %, placed at its 18.6th percentile, with forty-nine of the previous sixty months delivering stronger results. The Dow Jones Industrials Average had the weakest performance, falling 4.29 %. It ranked at the 10.1st percentile. This means that fifty-four of the past sixty months recorded a stronger performance.
Source: FactSet
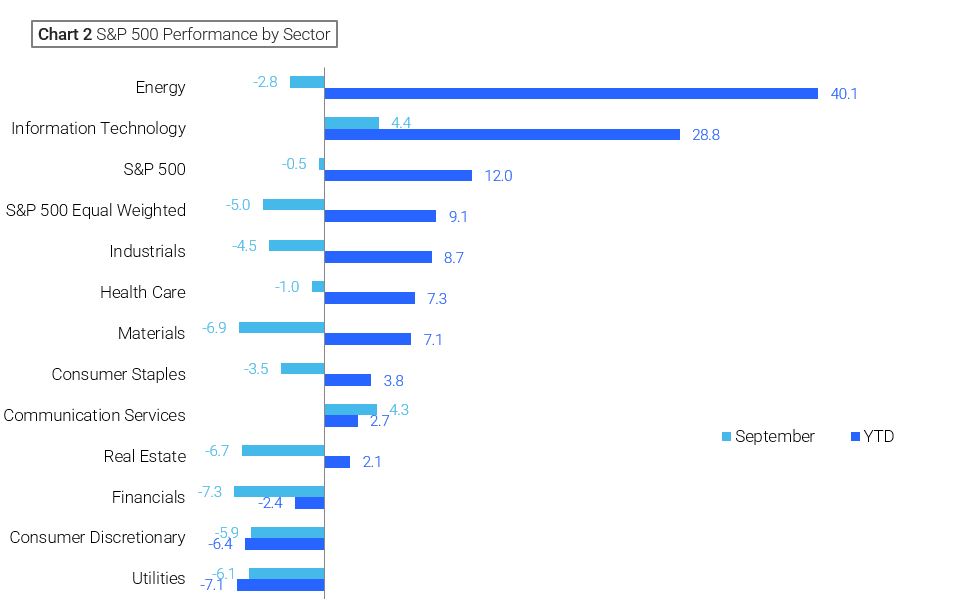
Nine of the eleven S&P 500 sectors were down in September. The only two sectors that ended the month in positive territory are Information Technology with a rise of 4.42 %, followed by Communication Services advancing 4.26 %. By contrast, Financials was the weakest performing sector, declining 7.28 %, followed by Materials at 6.93 % and Real Estate at 6.70 %.
Source: FactSet
European Equities Performance
Source: FactSet 5pm EDT 1 October 2026
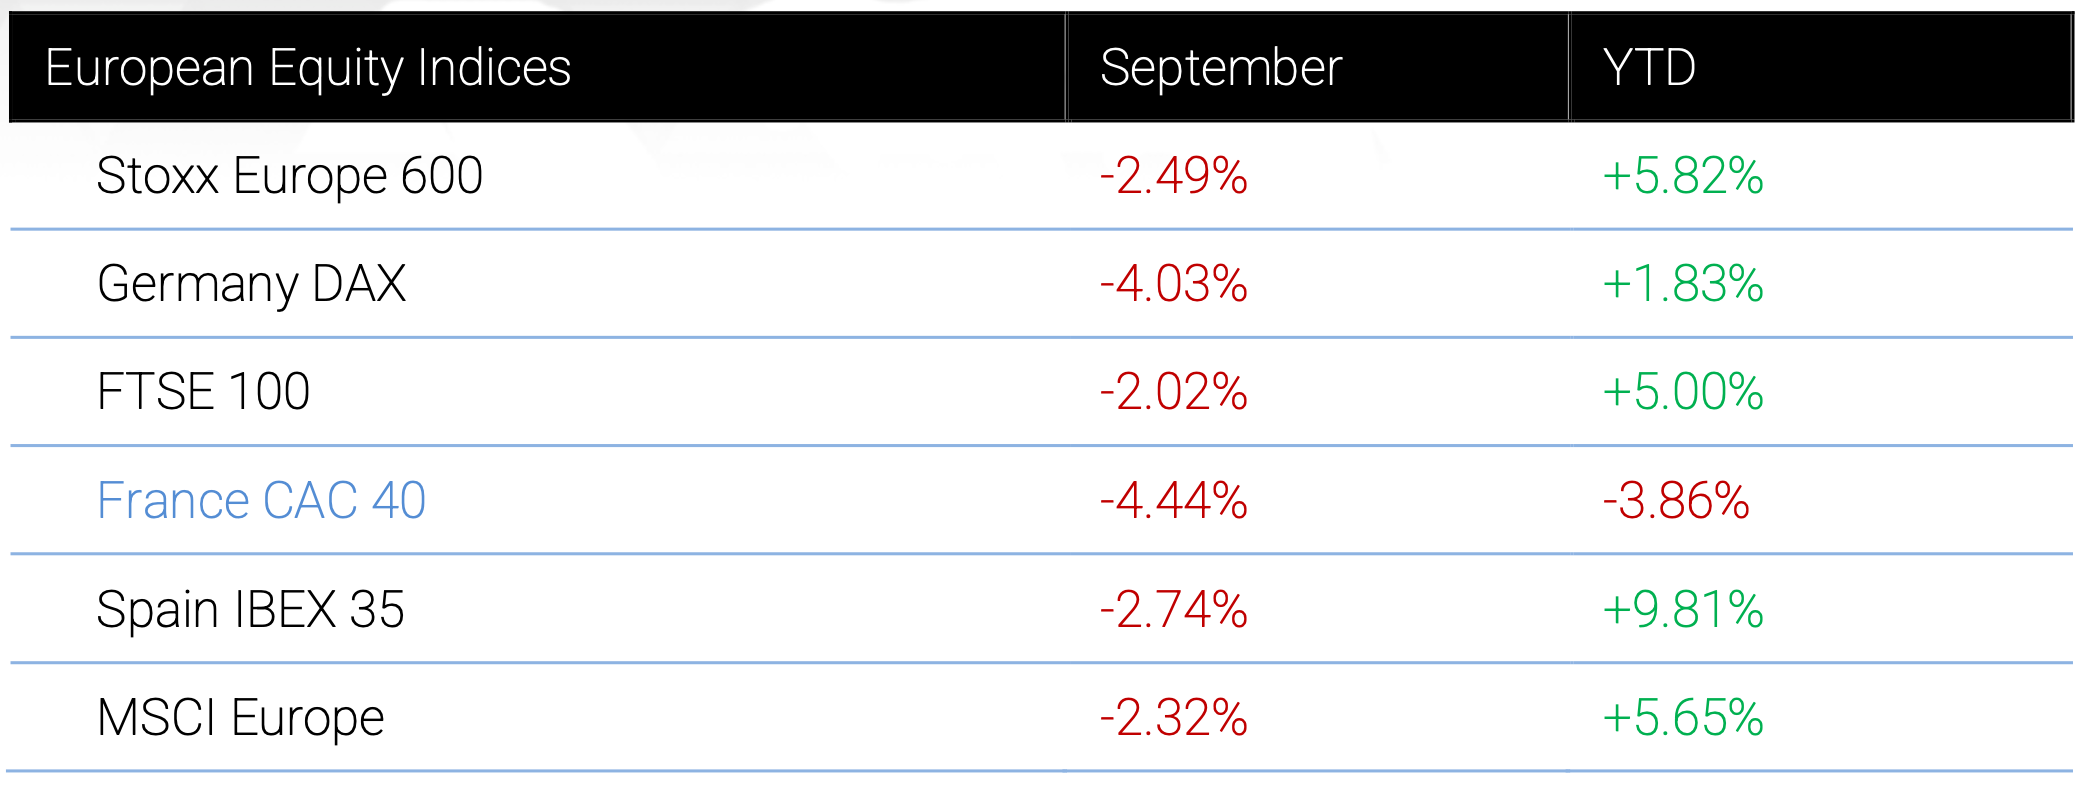
Despite divergence in the performance across individual countries, all six major indices recorded monthly returns lower than the 25th percentile of their respective 60-month distributions.
Germany’s DAX 4.03 % drop placed it at its 8.4th percentile, underperforming its European peers. Both Spain’s IBEX 35 and France’s CAC 40 September performance positioned them at their respective 11.8th percentile of their five-year performance distribution. On an absolute basis, Spain’s IBEX 35’s 2.74 % decline was still better than France’s CAC 40 loss of 4.44 %. The UK’s FTSE 100 fell 2.02 %, placing it at 15.2nd percentile, indicating that fifty-one months out of the past sixty produced stronger results.
In September, the Stoxx Europe 600 and MSCI Europe also delivered negative performances, with both ranking at their respective 22.0nd percentiles within their individual 60-month performance distributions.
Source: FactSet
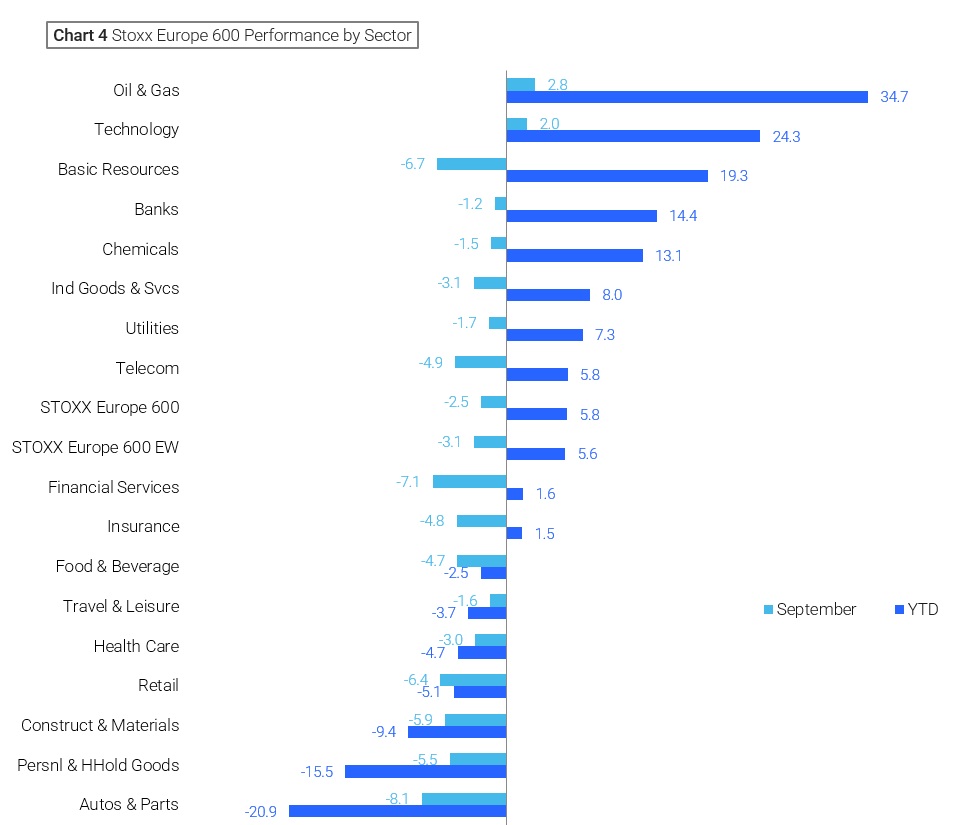
During the month of September, the Stoxx Europe 600 witnessed negative performance in fifteen out of its seventeen sectors. Oil & Gas and Technology outperformed within the index, advancing 2.75% and 1.96%, respectively. In contrast, Autos & Parts recorded a decline of 8.14%, followed by Financial Services and Basic Resources, down 7.09% and 6.67%, respectively.
Source: FactSet
Q3 Earnings Preview
With Q3 corporate earnings reporting season set to begin, market expectations for S&P 500 companies’ performance have been revised up from initial projections at the start of the quarter. The index is also forecast to report its eighth consecutive quarter of double-digit y/o/y earnings growth and the third consecutive quarter of earnings growth above 25 %.
According to FactSet, as of 25 September, the blended earnings growth rate for Q3 is 29.1 %, 2.4 percentage points higher than the 26.7 % forecast on 30 June. Should this figure hold, it will mark the thirteenth consecutive quarter of y/o/y earnings growth for the index and its eighth consecutive quarter of double-digit earnings growth.
For Q3, the proportion of S&P 500 companies issuing positive EPS guidance is higher than historical averages. Out of the 116 companies in the index that have provided guidance for Q3 2026 so far, 72 have issued positive EPS guidance, while 44 have issued negative guidance. The resulting 62.1 % rate of positive guidance is above the 5- and 10-year averages of 43.0 % and 41.0 %, respectively.
The increase in overall earnings growth rate expectations since 30 June can primarily be attributed to upward revisions in four sectors, led by Energy, Information Technology and Financials. It is partially offset by downward revisions to earnings estimates in Materials, Consumer Staples and Health Care.
S&P earnings estimate revisions: what’s changed and where
The current estimate of $798.2 billion Q3 2026 S&P 500 earnings growth is 1.9 % higher than the initial estimate of $783.3 billion at the beginning of the quarter.
The estimated earnings for the Energy sector have increased by 18.0 % since the start of Q3, from $47.0 billion to $55.5 billion, with 42.9 % of the companies experiencing an increase in their mean EPS estimate. This now implies a y/o/y earnings increase of 111.4 %, compared to an expected y/o/y earnings increase of 79.3 % on 30 June.
Since the beginning of Q3, Information Technology has experienced the second-largest percentage increase in estimated dollar-level earnings among all eleven sectors. Estimates have been revised up 4.1 % from $247.0 billion to $257.2 billion. As a result, the sector's estimated y/o/y earnings have shifted from a projected growth rate of 57.0 % on 30 June to an anticipated 63.5 % growth rate. Overall, 79.7 % of companies in the sector — 59 out of 74 — have experienced an increase in their mean EPS estimate over this period.
In contrast, Materials has recorded the largest percentage decrease in estimated dollar-level earnings among all eleven sectors since the start of Q3, with an 8.9% decline from $18.1 billion to $16.5 billion. The estimated y/o/y earnings growth rate for the sector has fallen from 42.4 % on 30 June to 29.7 % now. More than three-quarters of companies in the sector, 76.0%, have seen their mean EPS estimates decrease over the quarter.
Nevertheless, the bottom-up EPS estimate for Q3 — which reflects the aggregated median earnings forecasts for each of the 503 companies in the S&P 500 and serves as a proxy for the index's overall earnings — has increased by 1.3% since 30 June. It is common practice for analysts to lower earnings estimates during a typical quarter. Over the past five years or 20 quarters, earnings expectations have on average decreased by 2.2% throughout each quarter.
Changing revenue expectations: who will lead
The estimated y/o/y revenue growth rate for Q3 2026 is 12.1 %. This is above the 5- and 10-year averages of 8.7 % and 6.3 %, respectively. Should the actual revenue growth rate for Q3 reach 12.1 %, it would be the third consecutive quarter of double-digit growth for the index. At the sector level, all eleven sectors are anticipated to achieve y/o/y revenue increases, with Information Technology, Energy and Communication Services expected to lead this expansion.
S&P 500 Earnings Growth rate projections for Q3
The projected y/o/y earnings growth rate for Q3 is 29.1%. This figure is above the 5-year average of 16.4% and the 10-year average of 10.3 %. Sector-specific analysis reveals that all eleven sectors within the S&P 500 are reporting y/o/y earnings growth, led by Energy, Information Technology, Communication Services and Materials. Five of eleven sectors are reporting double-digit growth.
Energy is expected to report a y/o/y earnings growth of 111.4 %. At the sub-industry level, four of five sub-industries in the sector are projected to report y/o/y earnings growth. The Oil & Gas Refining & Marketing and Integrated Oil & Gas sub-industries are expected to be the largest contributors to earnings growth for the sector. Both projected to report earnings growth above100 %. Oil & Gas Equipment & Services is the only sub-industry expected to record a y/o/y earnings decline. At the company level, the largest upward EPS estimate revisions since the quarter began were for Marathon Petroleum, rising from $10.43 to $22.70; Valero Energy, from $9.66 to $18.92; and Phillips 66, from $6.38 to $10.86.
Information Technology is forecast to deliver the second-highest y/o/y earnings growth among the eleven sectors, rising by 63.5 %. All six constituent industries are expected to record earnings growth, with Semiconductors & Semiconductor Equipment projected to provide the largest contribution to the sector’s performance. Excluding this industry, the sector’s estimated earnings growth rate would fall from 63.5 % to 24.2 %. At the company level, the most significant upward EPS estimate revisions are for Super Micro Computer, to $1.04 from $0.66; Dell Technologies, to $6.56 from $4.21; Intel, to $0.39 from $0.26; and Teradyne, to $2.08 from $1.50.
Communication Services is expected to record the third-highest y/o/y earnings growth among the eleven sectors, at 51.3 %. All five industries within the sector are projected to deliver earnings growth, led by Media and Entertainment. At the company level, the largest upward EPS estimate revisions are for Meta Platforms, to $6.77 from $1.05; and EchoStar, to 7 cents from an expected loss of $44.37.
As of 1 October, according to LSEG I/B/E/S data for the Stoxx 600, Q3 2026 earnings are expected to increase 19.4 % from Q3 2025. Excluding the Energy sector, earnings are expected to increase 9.9 %. Q3 2025 revenue is expected to increase 10.6 % from Q3 2025. Excluding the Energy sector, revenues are expected to increase 4.3 %.
The Stoxx 600 expects to see share-weighted earnings of €156.8 billion in Q3 2026 compared to share-weighted earnings of €131.3 billion (based on the year-ago earnings of the current constituents) in Q3 2025.
Nine of the ten sectors in the index expect improved earnings compared to Q3 2025. At 98.6 %, Energy has the highest earnings growth rate for the quarter, while Real Estate has the highest anticipated contraction of 71.4 % compared to Q3 2025.
The forward four-quarter price-to-earnings ratio (P/E) for the Stoxx 600 sits at 13.7x. This is below its 10-year average of 14.2x.
Analysts anticipate positive Q3 earnings growth in fifteen of the sixteen Stoxx 600 index countries. Poland, with an estimated growth rate of 91.2 %, and Norway, at 75.2 %, are projected to have the highest earnings growth, followed by Netherlands at 53.2 % and Portugal at 49.2 %, whereas Ireland is expected to experience a decline in earnings of 7.4 %.
Projected Q3 2026 S&P 500 Net Profit margin: winners and losers
The Q3 projected net profit margin for the S&P 500 stands at 15.0 %. This is below Q2’s net profit margin of 17.0 %, but above both the margin from Q3 2025, which was 13.0 %, and the five-year average of 12.4 %.
At the sector level, six sectors are forecast to achieve a y/o/y increase in net profit margins compared to the same period in 2025. Energy is expected to lead this growth, followed by Information Technology. Conversely, five sectors are anticipated to experience a y/o/y decline in net profit margins, with Financials showing the most pronounced decrease.
Eight sectors are forecast to report net profit margins in Q3 that exceed their respective five-year averages. Information Technology is expected to show the most significant improvement, attaining 32.2 % compared to a five-year average of 25.6 %. In contrast, three sectors are forecast to report net profit margins below their five-year averages, led by Real Estate, which is expected to post a margin of 34.0 %, lower than its five-year average of 35.6 %.
Earnings Forecasts for the coming quarters
Looking ahead, analysts are forecasting y/o/y earnings growth rates of 26.8 %, 18.4 % and 1.7 % for Q4 2026, Q1 2027 and Q2 2027, respectively. For the entirety of calendar year 2026, analysts are anticipating a y/o/y earnings growth of 32.0 %.
As of 25 September, the bottom-up target price over the next 12 months for the S&P 500 is set at 9,275.04. This is a 19.8 % increase over September’s closing price of 7,743.41.
Based on the difference between bottom-up target prices and closing prices, the sectors with the most significant anticipated price appreciation are Utilities, at 28.0 %, Consumer Discretionary at 26.0 % and Industrials at 25.1 %. In comparison, the smallest expected price increases are forecast for Energy, expected to increase by 10.6 %. This is followed by Health Care, expected to have an 11.7 % rise, and Consumer Staples, anticipated to advance 15.6 %.
Which sectors are sell-side analysts most bullish and bearish about now?
According to FactSet, as of 25 September, there are currently 13,097 analyst ratings on S&P 500 constituents. Of these, 59.9 % are designated as Buy ratings, 35.5 % as Hold and 4.7 % as Sell. This represents the highest proportion of Buy ratings at month-end since at least 2010.
At the sector level, analyst sentiment is most favourable towards Information Technology and Communication Services. Both have Buy ratings comprising 70 % of total ratings. This is followed by Materials, with 64 %.
Conversely, analysts are least optimistic regarding Consumer Staples, Utilities and Financials, assigning Buy ratings to just 45 %, 53 %, and 54 % of these sectors, respectively. Consumer Staples carries the highest proportion of Hold ratings at 47 %, as well as the largest share of Sell ratings at 7 %. Financials follows, with 6 % of its ratings as Sell.
What to consider next
One less appreciated influence on both bond and equity markets may be the provisions in the One Big Beautiful Bill Act (OBBBA) in terms of CapEx and accelerated depreciation. These provisions encourage investment and, in turn, greater corporate debt issuance. Although the OBBBA does not directly increase borrowing, its tax benefits initially strengthen internal cash generation. It also expands the number of projects that meet corporate investment thresholds.
Debt financing therefore closes the timing gap between the initial expenditure and the subsequent tax, productivity and revenue benefits. In this way, the legislation accelerates CapEx and, at the margin, corporate issuance. At the same time, the reduction in federal revenue resulting from the OBBA’s lower tax rate regime, put pressure on the government to find alternative finance to meet fiscal requirements. The CBO projects fiscal deficits of at least 5.6 % of GDP from 2026 through 2036. To cover these deficits, the COB also project that there will be a further $26 trillion in federal borrowing between the end of 2025 and the end of 2036.
This increase in corporate borrowing, particularly by AI hyperscalers who are also among the best performing stocks, appears to be resulting in a crowding out sovereign issuance, i.e., governments have to pay a higher yield to attract investors. AI hyperscalers had issued about $220 billion of debt by 10 August, against $12.5 billion over the comparable 2025 period per BNP Paribas, as reported by Reuters.
And it is not just the OBBA which is affecting the yield curve. The $8 trillion of defence spending that G7 governments have committed to over the next decade is also adding pressure. A significant share of this defence expenditure will also support technology, including drones, cyber defence, encryption, hypersonic systems, secure data centres and battlefield artificial intelligence. Consequently, the defence and AI CapEx cycles are interconnected, even though their funding channels differ. Sovereigns issue debt to finance procurement, while contractors and infrastructure providers borrow to deliver the required capabilities.
Corporate refinancing compounds the situation. Roughly $4.3 trillion of US non-financial corporate bonds mature between 2027 and 2031, according to a Reuters analysis of LSEG data. Treasury dealers foresee a $1.3 trillion federal funding shortfall in fiscal 2027-28 at current coupon-auction sizes and bill supply. Marginal savings must therefore fund maturing corporate debt, new AI capacity, rearmament and Treasury deficits at the same time. Higher clearing yields are the market’s reaction function.
At the same time, stronger earnings expectations and more robust, though increasingly concentrated, stock growth may contribute to wider fiscal deficits. This is because of the narrowing tax base, i.e., fewer hyper-profitable companies, means tax revenues from those companies become more volatile. These companies, by issuing debt are encouraging fiscal expansion and keeping borrowing costs elevated, allowing spending and interest costs to outpace receipts. Additionally, supply-driven inflation may erode real incomes and corporate profitability. As a result, tighter monetary policy, i.e., higher interest rates, could produce unintended adverse effects. Extended tightening could create access-to-capital pressures within parts of the AI ecosystem where external financing has become increasingly important.
For now, equity investors appear increasingly comfortable with corporate credit, supported by strong profitability, robust balance sheets and demand for alternatives to government bonds. However, persistent fiscal borrowing should make investors more cautious about because of this upward pressure on the term premium. The central question is whether this represents a temporary pricing anomaly or not. If fiscal pressures continue to weigh on the long end of the curve, it could have significant implications for multi-asset portfolios.
Tento článek je poskytován pouze pro informační účely a neměl by být považován za nabídku nebo výzvu k nákupu nebo prodeji jakýchkoli investic nebo souvisejících služeb, jejichž odkazy se v něm můžou vyskytovat. Obchodování s finančními nástroji je spojeno se značným rizikem ztráty a nemusí být vhodné pro všechny investory. Dřívější produktivita není spolehlivým ukazatelem budoucí produktivity.




Přihlásit se k odběru přehledů trhu
Přihlásit se k odběru
přehledů
trhu
Předplaťte si nyní Předplaťte si nyní


Založeno profesionály. Pro profesionály.
