Corporate Earning Calendar
13 February - 19 February 2025
Thursday: Deere & Co., Airbnb, Applied Materials, Coinbase Global, Palo Alto Networks, Twilio, Unilever, Nestlé, Sony, Duke Energy, Digital Realty Trust, PG&E, Global Payments
Friday: Moderna, Fortis
Tuesday: Baidu, Medtronic, Arista Networks, Occidental Petroleum, Vulcan Materials, Devon Energy, Toll Brothers, EQT, Cadence Design Systems
Wednesday: Etsy, Fiverr International, Jackson Financial, Analog Devices, Progressive Corp., Glencore, Rio Tinto, Manulife Financial
Global market indices
US Stock Indices Price Performance
Nasdaq 100 +1.00% MTD and +3.24% YTD
Dow Jones Industrial Average +0.11% MTD and +4.82% YTD
NYSE +0.32% MTD and +5.05% YTD
S&P 500 +0.19% MTD and +2.90% YTD
The S&P 500 is -0.16% over the past week, with 6 of the 11 sectors down MTD. The Equally Weighted version of the S&P 500 is -0.95% this week. Its performance is -0.95% MTD and +2.42% YTD.
The S&P 500 Consumer Staples sector is the leading sector so far this month, up +3.52% MTD and +5.47% YTD, while Consumer Discretionary is the weakest at -4.58% MTD and -0.39% YTD.
This week, Consumer Staples outperformed within the S&P 500 at +2.43%, followed by Information Technology and Utilities at +1.22% and +1.05%, respectively. Conversely, Consumer Discretionary underperformed at -3.10%, followed by Health Care and Energy, at -1.83% and -1.52%, respectively.
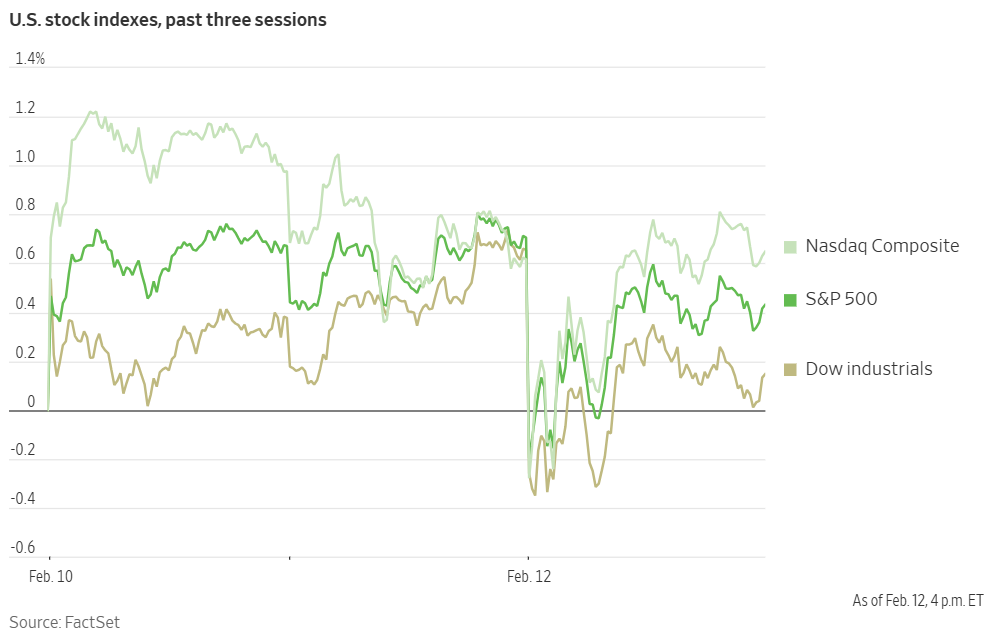
US equity markets declined on Wednesday following the release of the first inflation data for 2025. The consumer price index's 3.0% y/o/y increase in January, accelerating from December's 2.9% rate, exceeded economists' forecasts and renewed concerns regarding persistent inflationary pressures. This has led market participants to lower rate expectations.
The Dow Jones Industrial Average was -0.5%, approximately 225 points on Wednesday. The S&P 500 fell by -0.3%. The Nasdaq Composite, primarily composed of technology stocks, saw a marginal increase of less than +0.1%.
In corporate news, Reddit's Q4 user growth fell short of Wall Street expectations, suggesting that the recently public company is facing challenges competing with larger digital advertising rivals such as Meta Platforms and Alphabet's Google.
Apple expanded the availability of its TV+ video service to Android phones for the first time, a move intended to increase its streaming subscriber base.
Robinhood Markets reported a more than doubling of revenue, driven by increased cryptocurrency trading activity surrounding the US presidential election.
Kraft Heinz announced plans to discount key products in the coming year while simultaneously improving product quality and increasing marketing efforts to attract price-sensitive consumers.
DoorDash, the leading food delivery service in the US, issued a Q1 order outlook that exceeded analysts projections, further indicating resilient consumer demand.
CVS Health shares experienced their most significant increase in over 25 years following Q4 results that signaled improved performance from the company, whose insurance and drugstore divisions have faced recent challenges.
According to LSEG I/B/E/S data, y/o/y earnings growth for the S&P 500 in Q4 is projected to be 15.1%. This number jumps to 18.6% when excluding the Energy sector. Of the 343 companies in the S&P 500 that have reported earnings to date for Q4 2024, 76.4% have reported earnings above analyst estimates, with 62.1% of companies reporting revenues exceeding analyst expectations. Nine of the eleven sectors in the index expect to see an improvement in earnings y/o/y. Communication Services at 32.2% and Financials at 29.9% have the highest earnings growth rates for Q4, while the Energy sector has the largest anticipated decline compared to the prior year, at 30.0%. The y/o/y revenue growth is projected to be 4.9% in Q4, increasing to 5.5% when excluding the Energy sector.
Financials, at 85.3%, was the sector with most companies reporting above estimates, additionally, Consumer Discretionary with a surprise factor of 14.1%, is the sector that’s beaten earnings expectations by the highest surprise factor. Within Real Estate, only 53.3% of companies have reported above estimates, while Industrials is the sector with the lowest earnings surprise factor at -2.9%. The S&P 500 surprise factor is 6.5%, which compares to a long-term average surprise factor of 4.2% (since 1994) and the average surprise factor over the prior four quarters of 6.6%. The forward four-quarter price-to-earnings ratio (P/E) for the S&P 500 sits at 22.4x.
Mega caps: The Magnificent Seven had a mixed performance this week with Nvidia +5.05%, Meta Platforms +2.91%, and Apple +1.89%, while Microsoft -1.03%, Amazon -3.07%, Alphabet -4.17%, and Tesla -11.02%.
Energy stocks demonstrated a varied performance this week, with the Energy sector itself -1.52% due to concerns of subdued demand amid potential imposition of indiscriminate tariffs by the White House. WTI and Brent prices are up this week, +0.03% and +0.40%, respectively. Over the week BP +10.57%, Shell +2.14%, Chevron +1.97%, Hess +1.44%, Phillips 66 +1.39%, Occidental Petroleum +0.99%, and Apa +0.81%, while Baker Hughes -1.21%, Halliburton -1.22%, ConocoPhillips -1.81%, ExxonMobil -2.30%, Marathon Petroleum -5.15%, and Energy Fuels -5.79%.
Materials and Mining stocks had a mostly negative performance this week, with the Materials sector -0.50%. Newmont Corporation +4.11%, Freeport-McMoRan +2.18%, and Nucor +0.26%, while Albemarle -4.11%, Sibanye Stillwater -4.44%, Yara International -5.46%, Mosaic -5.97%, and CF Industries -9.48%.
European Stock Indices Price Performance
Stoxx 600 +1.53% MTD and +7.91% YTD
DAX +1.91% MTD and +11.25% YTD
CAC 40 +1.16% MTD and +8.96% YTD
IBEX 35 +4.39% MTD and +11.35% YTD
FTSE MIB +3.04% MTD and +9.93% YTD
FTSE 100 +1.54% MTD and +7.76% YTD
This week, the pan-European Stoxx Europe 600 index was +1.71%. It was +0.11% on Wednesday, closing at 547.78.
So far this month in the STOXX Europe 600, Banks is the leading sector, +5.74% MTD and +15.79% YTD, while Utilities is the weakest at -2.10% MTD and -0.78% YTD.
This week, Banks outperformed within the STOXX Europe 600 with a +5.70% gain, followed by Construction & Materials and Retail at +3.54% and +3.16%, respectively. Conversely, Utilities underperformed at -3.02%, followed by Travel & Leisure and Health Care, at -1.01% and -0.84%, respectively.
Germany's DAX index was +0.50% on Wednesday, closing at 22,148.03. It was +2.60% for the week. France's CAC 40 index was +0.17% on Wednesday, closing at 8,042.19. It was +1.91% for the week.
The UK's FTSE 100 index was +2.14% this week to 8,807.44. It was +0.34% on Wednesday.
On Wednesday, the Food, Beverage, and Tobacco sector in the Stoxx Europe 600 index emerged as the top performer, led by Heineken's significant gains following a positive FY EPS surprise, a dividend increase, a €1.5 billion share buyback program, and robust forward guidance. Anora Group also exceeded Q4 estimates. Real Estate and Retail sectors also outperformed the broader market.
Banks were also higher, primarily driven by Banco BPM's plan to increase its bid for Anima Holding, coinciding with strong FY earnings and higher 2025 guidance. ABN Amro Bank reached a 52-week high after surpassing Q4 estimates, although net income fell short. Commerzbank announced job cuts and new targets to keep UniCredit. Conversely, the Healthcare sector experienced significant declines, largely attributed to Carl Zeiss Meditec's stock price drop despite exceeding 1Q EPS, citing margin pressure.
The Energy sector lagged, influenced by lower crude oil prices. Siemens Energy reported 1Q EPS of €0.23, compared to the FactSet consensus of €0.18, and issued FY guidance including profit margin before special items between 3% to 5%. Aker BP missed Q4 EPS despite strong guidance. The Industrial Goods & Services and Personal & Household Goods sectors also underperformed the broader market.
Other Global Stock Indices Price Performance
MSCI World Index +0.48% MTD and +3.97% YTD
Hang Seng +8.07% MTD and +8.96% YTD
This week, the Hang Seng Index was +6.12%, while the MSCI World Index was +0.16%.
Currencies
EUR +0.28% MTD and +0.36% YTD to $1.0384.
GBP +0.38% MTD and -0.56% YTD to $1.2444.
The euro was -0.18% against the USD over the past week, while the British pound was -0.46% against the dollar. The Dollar Index is +0.33% so far this week, -0.36% MTD and -0.47% YTD.
US consumer prices saw their most significant increase in nearly 18 months in January. The headline CPI rose 0.5% in January, while the core CPI increased by 0.4%, both surpassing the anticipated 0.3% rise. This translates to a 3.0% annual increase in the headline CPI, exceeding the projected 2.9% rise, and a 3.3% annual increase in core prices, also above the expected 3.1%.
Following this data release, interest rate futures traders are now pricing in 27 basis points of rate cuts by December, down from approximately 37 basis points prior to the data, suggesting a greater likelihood of only one 25-basis-point cut this year.
During his second congressional hearing this week, Fed Chair Jerome Powell reiterated that the central bank is not in a hurry to reduce interest rates, while acknowledging the ‘great progress’ made in controlling inflation.
Consequently, the dollar rose by +1.24% to ¥154.32. The dollar index, after reaching a one-week high of 108.52, was last up +0.06% on the day at 107.98.
The euro also benefited from comments by Bundesbank President Joachim Nagel, who advocated for a gradual approach to policy easing by the ECB, rather than targeting a difficult-to-define neutral interest rate level. The euro was last up +0.21% at $1.0384.
The pound sterling remained broadly stable against the US dollar at $1.2444, but dipped slightly to 83.37 pence per euro.
Note: As of 5:00 pm EST 12 February 2025
Cryptocurrencies
Bitcoin -5.10% MTD and +4.22% YTD to $97,506.15.
Ethereum -18.49% MTD and -19.55% YTD to $2,682.39.
Bitcoin is +1.05% and Ethereum -2.80% over the past week. Bitcoin continues to be affected by rising market uncertainty around tariffs and the strength of the US economy. On Wednesday it remained under the $100,000 mark after the release of January CPI data, which came in above expectations at 3%. This dampened expectations of further Federal Reserve rate cuts later this year. Market participants appear to be in a more risk off mode due to ongoing inflation and the threat of tariffs potentially stoking inflation and making the Federal Reserve less likely to cut rates. Higher rates imply greater yields on Treasuries, making them more attractive compared to cryptocurrency assets from both a return and riskiness perspective.
Note: As of 5:00 pm EST 12 February 2025
Fixed Income
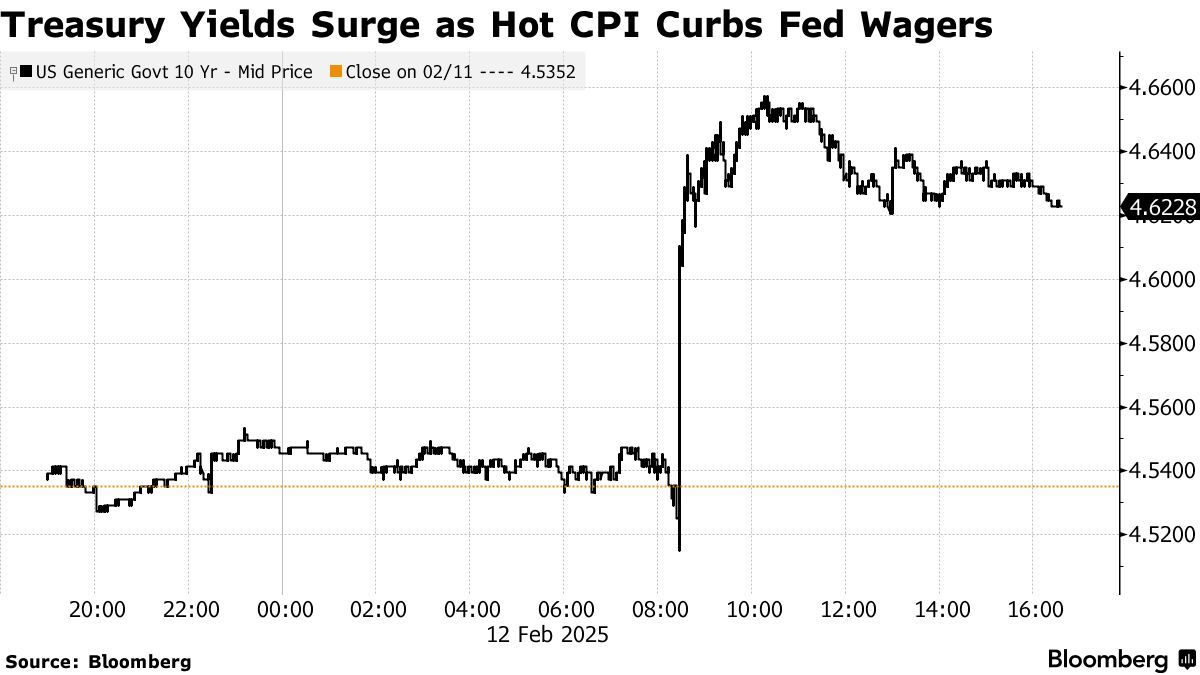
US 10-year yield +10.9 bps MTD and +5.2 bps YTD to 4.628%.
German 10-year yield -4.2 bps MTD and +11.2 bps YTD to 2.481%.
UK 10-year yield -3.1bps MTD and -3.0 bps YTD to 4.538%.
US Treasury 10-year bond yields are +19.6 bps over the past week.
US Treasury yields rose on Wednesday after stronger-than-anticipated inflation data reinforced expectations that the Fed is likely to maintain its current interest rate policy for an extended period. Yields also remained elevated following a weak 10-year note auction, the tepid demand for which was anticipated given the trend of weaker-than-expected results in prior auctions.
In afternoon trading, the 10-year yield increased by +9.7 bps to 4.629%, having earlier reached a near three-week high of 4.660%. This represents the largest daily increase in approximately two months. The 30-year yield also saw a substantial rise, up +10.3 bps to 4.851%, on track for its largest daily gain since mid-November.
On the short end of the curve, the two-year yield, which is sensitive to Fed policy expectations, climbed +7.5 bps to 4.370%, its largest daily increase since 10th January, after reaching its highest point since mid-January at 4.389% earlier in the session.
Following the inflation data release, US rate futures markets now anticipate only 27 bps of easing this year, equivalent to one rate cut, with the next potential reduction pushed back to either the October or December meeting, according to LSEG calculations. Previously, futures traders had largely priced in a likely easing in June.
The US Treasury's auction of $42 billion in 10-year notes on Wednesday was met with subdued demand. The note was priced at a high yield of 4.632%, approximately 1.0 bp higher than the expected rate at the bid deadline, indicating that investors required a premium to purchase the 10-year note. The bid-to-cover ratio was 2.48x, below the 2.53x average and also below the ratio observed in the January auction. This follows Tuesday’s Treasury’s $58 billion three-year note sale, which was well-received by market participants.
Across the Atlantic, the German 10-year yield was +11.6 bps over the past week, while the UK 10-year yield was +12.7 bps over the past 7 days. The spread between US 10-year Treasuries and German Bunds is 214.7 bps, 8.0 bps wider than last week.
Italian bond yields, a benchmark for the eurozone periphery, were +11.2 bps this week to 3.562%. Consequently, the spread between Italian and German 10-year yields is 108.1 bps, 0.4 bps narrower than last week.
French 10-year government bond yields are -12.0 bps to 3.202%. The yield premium over German 10-year yields is 72.1 bps.
German government bond yields have risen by over 10 bps in the past two days, following comments from Fed Chair Jerome Powell that the Fed is not accelerating a decrease in interest rates, and as US data supported expectations of a pause in monetary easing.
Germany's 10-year bond yield was up +4.8 bps at 2.481%, its highest level since 31st January, after rising by +6.8 bps the previous day. Germany's two-year yield rose +5.0 bps to 2.13%.
Analysts anticipate that tariffs will contribute to increased inflation in the US, while in the euro area, they could potentially trigger a deflationary shock, as the negative impact on growth may outweigh the inflationary effects of retaliatory measures. However, European gas prices (TTF), reached their highest point in almost two years this week and reignited inflation concerns among market participants.
Money markets now price in an ECB deposit facility rate of 1.97% in December, up from 1.85% on Monday before Powell's speech. The deposit rate is currently 2.75%.
Italy's 10-year yield was up +2.7 bps at 3.562%.The yield spread between Italian and German yields narrowed by 2.1 bps on Wednesday.
Commodities
Gold spot +3.43% MTD and +10.64% YTD to $2,903.77 per ounce.
Silver spot +1.30% MTD and +11.76% YTD to $32.53 per ounce.
West Texas Intermediate crude +0.66% MTD and +1.21% YTD to $71.21 a barrel.
Brent crude -0.79% MTD and +0.58% YTD to $74.99 a barrel.
Gold prices are +1.27% this week after hitting their highest level on Tuesday.
Gold prices advanced slightly on Wednesday, buoyed by safe-haven demand amid fears of a global trade war spurred by the White House's new tariffs as the market digested hotter-than-expected US inflation data.
Spot gold was 0.20% higher at $2,903.77 per ounce.
Prices dropped more than one percentage point after data showed the US CPI jumped 0.5% m/o/m, more than expected, strengthening the Fed's message that it was not prepared to resume cutting interest rates amid growing uncertainty over the economy.
This week, WTI and Brent are +0.03% and +0.40%, respectively on supply concerns due to sanctions on Iranian and Russian production. Oil prices declined by more than 2% on Wednesday following the US President's initiation of diplomatic efforts regarding the conflict in Ukraine, a conflict that has previously supported oil prices due to concerns about global supply disruptions. The US President engaged in discussions regarding the war in Ukraine with both Russian President Vladimir Putin and Ukrainian President Volodymyr Zelensky via telephone. Russia may face constraints on its oil production in the coming months due to US sanctions impacting its access to tankers for shipments to Asia, coupled with Ukrainian drone attacks affecting its refineries.
Brent crude futures settled down $1.81, or -2.36%, at $74.99 per barrel. WTI crude settled down $1.98, or -2.71%, to $71.21 per barrel. US crude futures hit session lows with declines of over $2. These decreases followed three days of gains, during which Brent climbed +3.6% and WTI rose +3.7%.
OPEC maintained its forecast in its monthly report, projecting global oil demand to increase by 1.45 million barrels per day (bpd) in 2025 and by 1.43 million bpd in 2026.
The US Energy Information Administration (EIA) increased its estimate for US crude oil production while holding its demand forecast steady on Tuesday. The EIA now projects US crude oil output to average 13.59 million bpd in 2025, up from its previous estimate of 13.55 million bpd.
The White House appointed Kathleen Sgamma, a prominent oil and gas advocate for Western states, to head the Interior Department's Bureau of Land Management, which oversees the use of nearly 250 million acres of public land in the US.
Refinery maintenance drives crude build, gasoline supply tightens in latest EIA report. US crude oil inventories increased last week due to ongoing refinery maintenance, while gasoline stockpiles unexpectedly decreased, the EIA reported on Wednesday.
Crude oil inventories rose by 4.1 million barrels to a total of 427.9 million barrels in the week ending 7th February, according to the EIA. Crude oil stocks at the Cushing, Oklahoma, delivery hub also increased, rising by 872,000 barrels last week.
Refinery crude runs saw a modest increase of 82,000 bpd, with utilisation rates rising by 0.5 percentage point to 85% of total capacity, the EIA data showed.
Gasoline inventories fell by 3 million barrels, reaching a total of 248.1 million barrels. Distillate inventories, encompassing diesel and heating oil, increased slightly by 135,000 barrels to 118.6 million barrels.
Total product supplied, a proxy for demand, decreased by 1.45 million bpd last week to 19.624 million bpd, primarily driven by a sharp decline in distillate demand.
Net US crude oil imports fell last week by 184,000 bpd, with imports from Iraq reaching a one-year low, the EIA noted. Crude oil exports from the US also declined, falling 422,000 bpd to 3.91 million bpd.
Note: As of 5:15 pm EST 12 February 2025
Key data to move markets
EUROPE
Thursday: German Harmonised Index of Consumer Prices, ECB Economic Bulletin, Eurozone Industrial Production, and speeches by ECB Executive Board member Piero Cipollone and Bundesbank President Joachim Nagel.
Friday: Spanish Harmonised Index of Consumer Prices, Eurozone GDP, and Eurozone Employment Change.
Monday: Bundesbank Monthly Report.
Tuesday: French CPI, German ZEW Current Situation and Economic Sentiment Surveys, and Eurozone ZEW Economic Sentiment Survey.
UK
Thursday: GDP, Industrial Production and Manufacturing Production.
Tuesday: Average Earnings, ILO Unemployment Rate, Claimant Count Change, Claimant Count Rate, and Employment Change.
Wednesday: CPI, PPI and RPI.
US
Thursday: Initial and Continuing Jobless Claims, PPI and Core PPI.
Friday: Retail Sales, Industrial Production, and a speech by Dallas Fed President Lorie Logan.
Monday: US Markets closed for Presidents’ Day.
Tuesday: NY Empire State Manufacturing Index and a speech by San Francisco Fed President Mary Daly.
Wednesday: Building Permits, Housing Starts, and FOMC Minutes.
JAPAN
Sunday: GDP.
Tuesday: Imports, Exports,and Merchandise Trade Balance.
Global Macro Updates
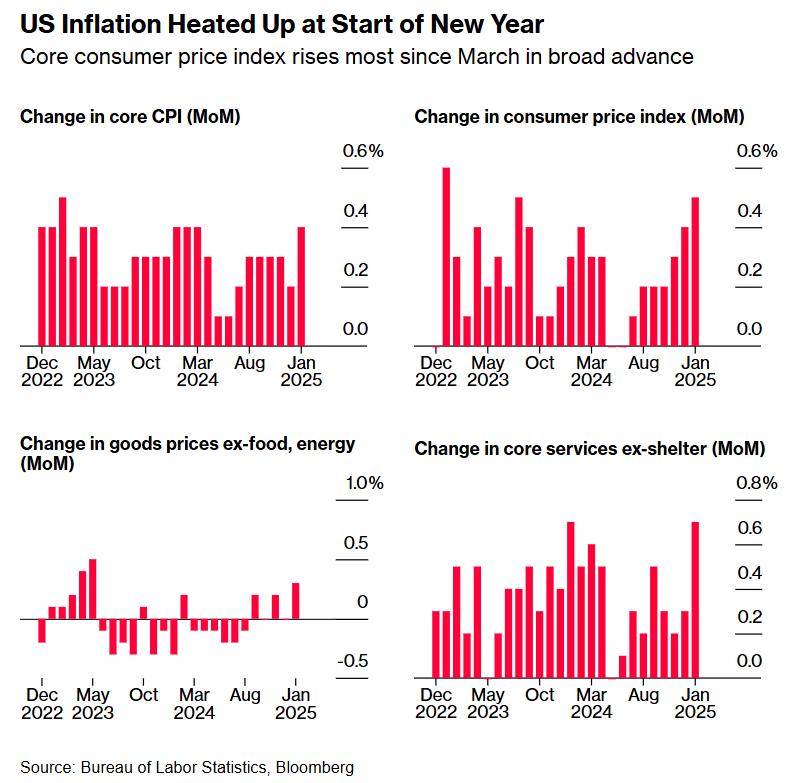
January CPI report. The January Consumer Price Index report was considerably higher than anticipated, with core CPI increasing 0.4% m/o/m, compared to the 0.3% consensus forecast and December's 0.2% rise. The annualised core CPI reached 3.3%, surpassing both the consensus and December's 3.2% figure. Headline CPI rose 0.5% m/o/m, above the 0.3% consensus and December's 0.4% increase. The annualised headline CPI reached 3.0%, exceeding the 2.9% consensus.
Shelter costs remained a persistent driver of inflation, with the index rising 0.4% and contributing nearly 30% to the overall monthly increase. Rent and Owners' Equivalent Rent (OER) both increased by a steady 0.3%, a moderation welcomed by analysts. Food prices accelerated, rising 0.4% m/o/m. Core goods saw their strongest growth in two years, primarily due to a 2.2% m/o/m increase in used car prices, partially offset by a 1.4% decline in apparel prices. Airline fares rose 1.2%, adding to December's 3.0% increase, while car insurance increased 2.0%, following last month's 0.5% rise. Energy prices increased 1.1% m/o/m.
Some analysts suggested that the January CPI data may have been affected by historically unique seasonal factors, potentially explaining the higher-than-expected figures. Nevertheless, analysts noted the increased difficulty of achieving the threshold for the next interest rate cut, with market expectations now shifting the timing of the next cut to December, later than the previously anticipated September timeframe.
Trump 2.0: policy ambiguity sends ripples through the economy. Increased policy uncertainty in the second Trump administration is driving economic unease. This contrasts sharply with the ‘animal spirits’ dynamic that was a prominent bullish narrative following the previous election. Initial areas of focus, including tariffs, deregulation, and immigration policy, are generating concerns about inflation, supply chain disruptions, unemployment levels, business hiring and investment decisions, and consumer traffic. These spillover effects have propelled an index of policy uncertainty to levels comparable to those observed during the pandemic and in the aftermath of the 2008 Global Financial Crisis, as reported by the Wall Street Journal.
Subdued deal activity is another concern. Press reports citing LSEG data indicate a nearly 30% y/o/y contraction in the overall number of US M&A in January, totaling 873 deals—the lowest level since 2015. In dollar terms, deal activity declined by 18% y/o/y. Furthermore, the pro-business agenda touted by the Trump administration has not yet resulted in the anticipated surge in IPO activity, according to a report by the Financial Times.
However, a positive development emerged last week with the Fed's Senior Loan Officer Opinion Survey, which revealed the first increase in Commercial and Industrial (C&I) loan demand since Q3 2022.
While every effort has been made to verify the accuracy of this information, EXT Ltd. (hereafter known as “EXANTE”) cannot accept any responsibility or liability for reliance by any person on this publication or any of the information, opinions, or conclusions contained in this publication. The findings and views expressed in this publication do not necessarily reflect the views of EXANTE. Any action taken upon the information contained in this publication is strictly at your own risk. EXANTE will not be liable for any loss or damage in connection with this publication.
Este artigo é-lhe fornecido apenas para fins informativos e não deve ser considerado como uma oferta ou solicitação de uma proposta para compra ou venda de quaisquer investimentos ou serviços relacionados que possam ser aqui referenciados. A negociação de instrumentos financeiros envolve um risco significativo de perda e pode não ser adequada para todos os investidores. O desempenho passado não é um indicador fiável do desempenho futuro.