

July Equity Review - Beneath the calm, a violent dispersion



Horacio Coutino, Multi-asset Strategist
Below the surface-stream, shallow and light,
Of what we say we feel – below the stream,
As light, of what we think we feel – there flows
With noiseless current strong, obscure and deep,
The central stream of what we feel indeed.
Matthew Arnold, The Buried Life, 1852
July was a month in which the tape told two stories simultaneously. At the index level, the S&P 500 finished marginally lower and its forward multiple compressed from 20.6x to 19.7x. This would seem to be the picture of a market pausing for breath. Beneath it, the quarter produced the strongest earnings acceleration since Q2 2021. The blended growth rate rose from 23.2% at quarter-end to 47.4% by 31 July. We also saw one of the clear leadership reversals of the cycle, as Information Technology fell from first-half leader to the month's underperforming sector while Energy, Financials, and Health Care moved to the front. That reversal was not confined to sector weightings.
The AI trade has splintered into layers whose prices and earnings revisions now diverge by tens of percentage points. Korea's equity market has become a high-beta expression of the memory cycle. It is a hyperscaler CapEx cycle now judged against its cost of capital rather than its narrative. We examine what that divergence means for positioning and why guidance across sectors has governed market reactions. For investors, the work ahead is discrimination, not conviction.
This report will analyse:
- S&P 500 earnings growth and estimates for Q2
- Sectoral revisions for Q2 and net profit margins
- Sector-specific monthly performance for US and European equities
For investors’ consideration: which emerging themes are worth considering after earnings season?
What July lacked in consensus, it did not lack in conviction. By 31 July, the S&P 500's blended Q2 earnings growth rate had accelerated from the 23.2% expected at quarter-end to 47.4%, marking the strongest print since Q2 2021. Yet beneath that index-level result, forward guidance, capital-allocation and cross-sector volatility pointed to a far more contested underlying story. As investors look to the end of this reporting season, several themes warrant close attention: sharp rotation beneath an otherwise calm headline tape; widening return and valuation dispersion across the layers of the AI buildout; Korea’s equity market increasingly acting as a high-beta proxy for the memory cycle; a hyperscaler CapEx debate that has moved from whether the spending is real to whether it can clear the cost of capital; a valuation multiple that has lagged the earnings and revisions story; and a season in which guidance has been the primary driver of market reactions.
Volatility beneath the surface. The S&P 500's summer gains concealed one of the cycle's leadership reversals. Information Technology, which had led the market in H1 with a 17.2% gain as of 30 June, became the weakest S&P 500 sector on a one-month basis by July, falling 3.5%. Energy, Financials, and Health Care moved to the top of the leaderboard. By early August, three dissents at the 29 July FOMC meeting in favour of a hike, together with a rising probability of a September move implied by CME FedWatch, introduced a second, rates-driven source of rotation risk. That shift placed greater pressure on the market's longest-duration cash flows. The lesson for positioning is that headline index stability can conceal violent cross-sector rotation, penalising single-factor exposure such as long AI infrastructure or short defensives. It is a market sentiment whose volatility has moved below the index to the layer, sector and single-name levels, where it is expressed through rotation. For investors, the analytical work has shifted decisively beneath the index.
Dispersion across the AI buildout's layers. The season's clearest visual evidence sits in the price-performance and NTM EPS-growth trackers for our Alpha Vibes AI taxonomy. Between 30 June and 31 July, Applications rallied 24.2%, while the remining six layers declined through July. Fabrication Materials and Memory & Storage declined by 30.4% and 23.6%, respectively. Compute & Silicon and Power & Electrification posted single-digit declines, yet underperformed the S&P 500’s modest decline of 0.13%. Perhaps more telling, the PHLX Semiconductor Index fell 20.6% over the same window, entering a technical bear market.
The spread of more than 54 percentage points between the best-performing layer, Applications, and the worst-performing layer, Memory & Storage, is the clearest signal yet that the AI trade no longer behaves as a single position. Forward NTM EPS growth tells a different story that may enhance price discovery across the AI taxonomy. Fabrication Materials recorded the strongest upward revision in forward earnings estimates during the month, rising 20.9%, followed by Physical Infrastructure & Site Readiness at 11.3% and Memory & Storage at 10.8%. Compute & Silicon increased by 4.4%, while Networking rose only 0.6% and Power & Electrification declined slightly by 0.6%. The implication is that price performance and earnings revisions have diverged meaningfully across layers. Memory & Storage, for example, received the third-largest earnings upgrade of the season, yet it experienced the steepest price drawdown.
By contrast, Defence, represented here by the Peace USA and Peace EU baskets, as outlined in our Alpha Vibes note on European Defence, delivered a steadier combination of price performance and earnings momentum. The baskets gained 8.9% and 6.7%, respectively, supported by continued backlog strength at Lockheed, RTX and General Dynamics, while forward EPS growth reached 3.3% for Peace USA and 4.5% for Peace EU in July. This resilience suggests that structural rearmament tailwinds have been re-rated more orderly than the AI trade, whose exceptional second-half performance has become harder to justify amid growing scepticism over the ROIC of the AI CapEx supercycle and the durability of its momentum. As a result, AI-linked exposure remains vulnerable to volatile unwinding, even though its underlying fundamentals remain intact.
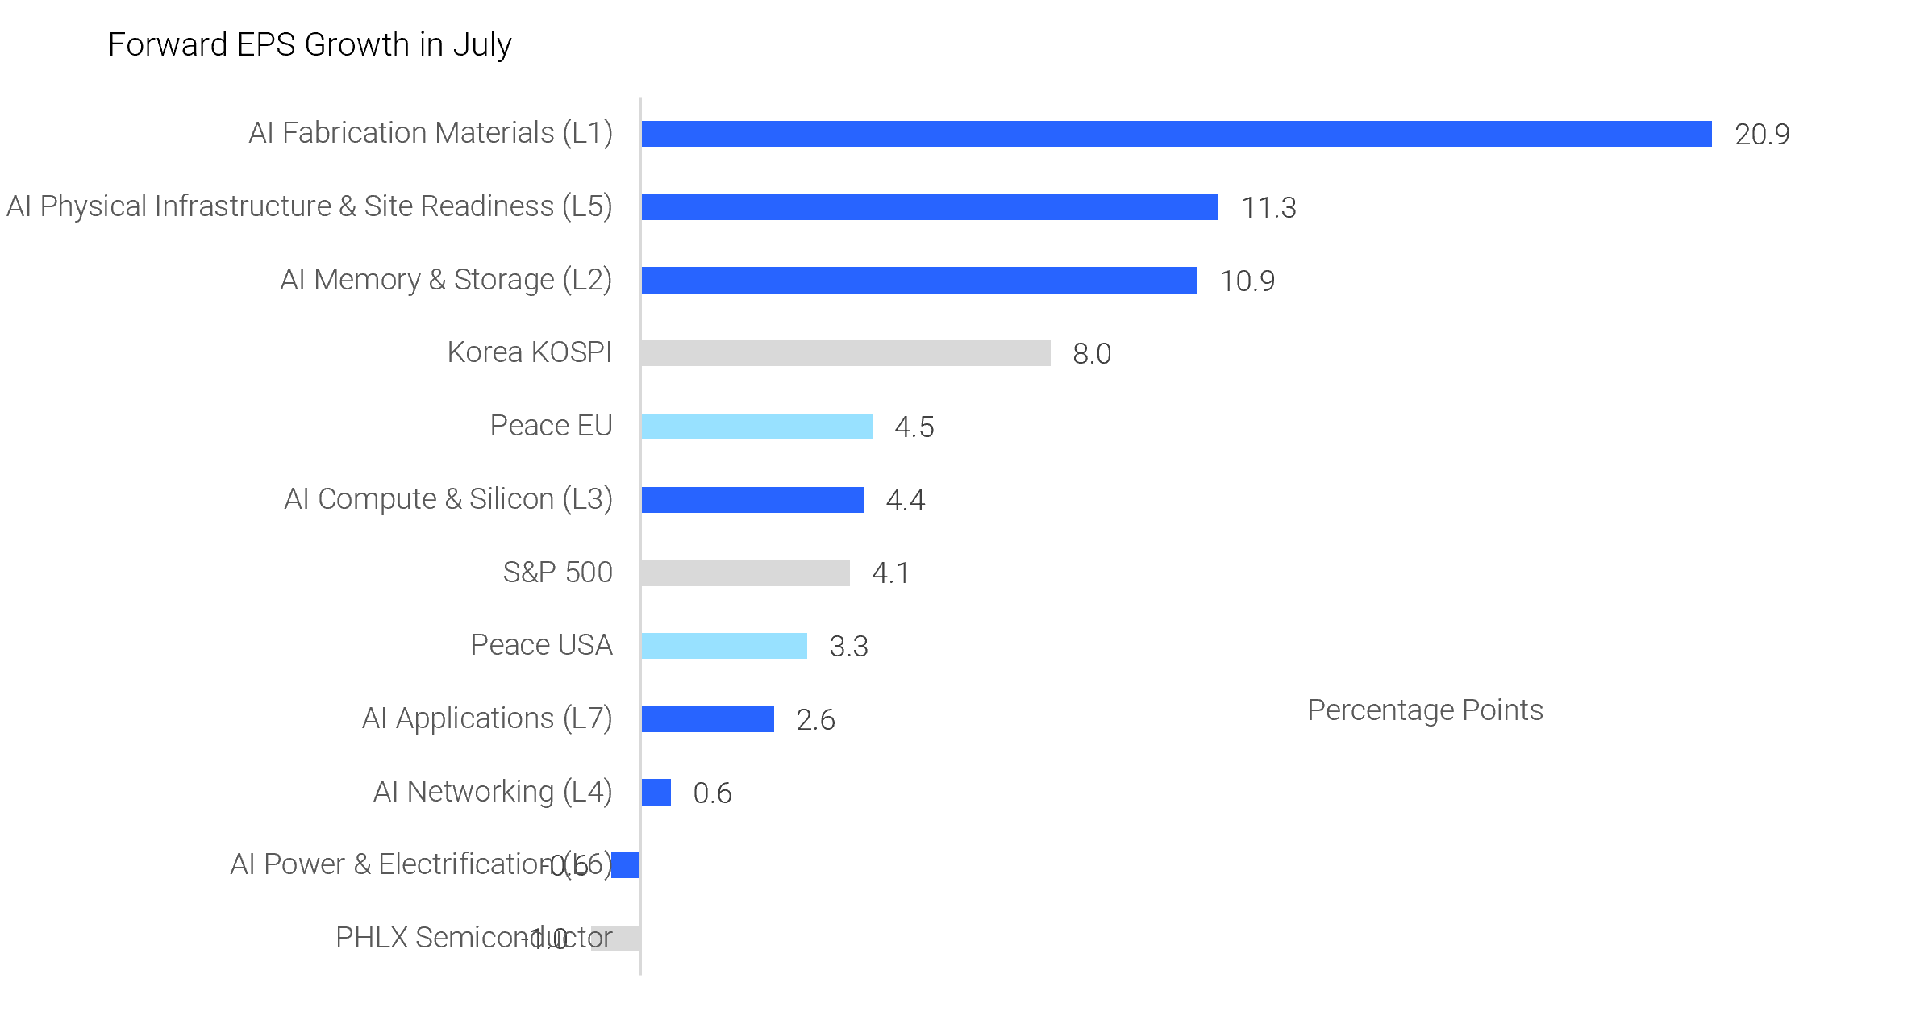
Source: FactSet
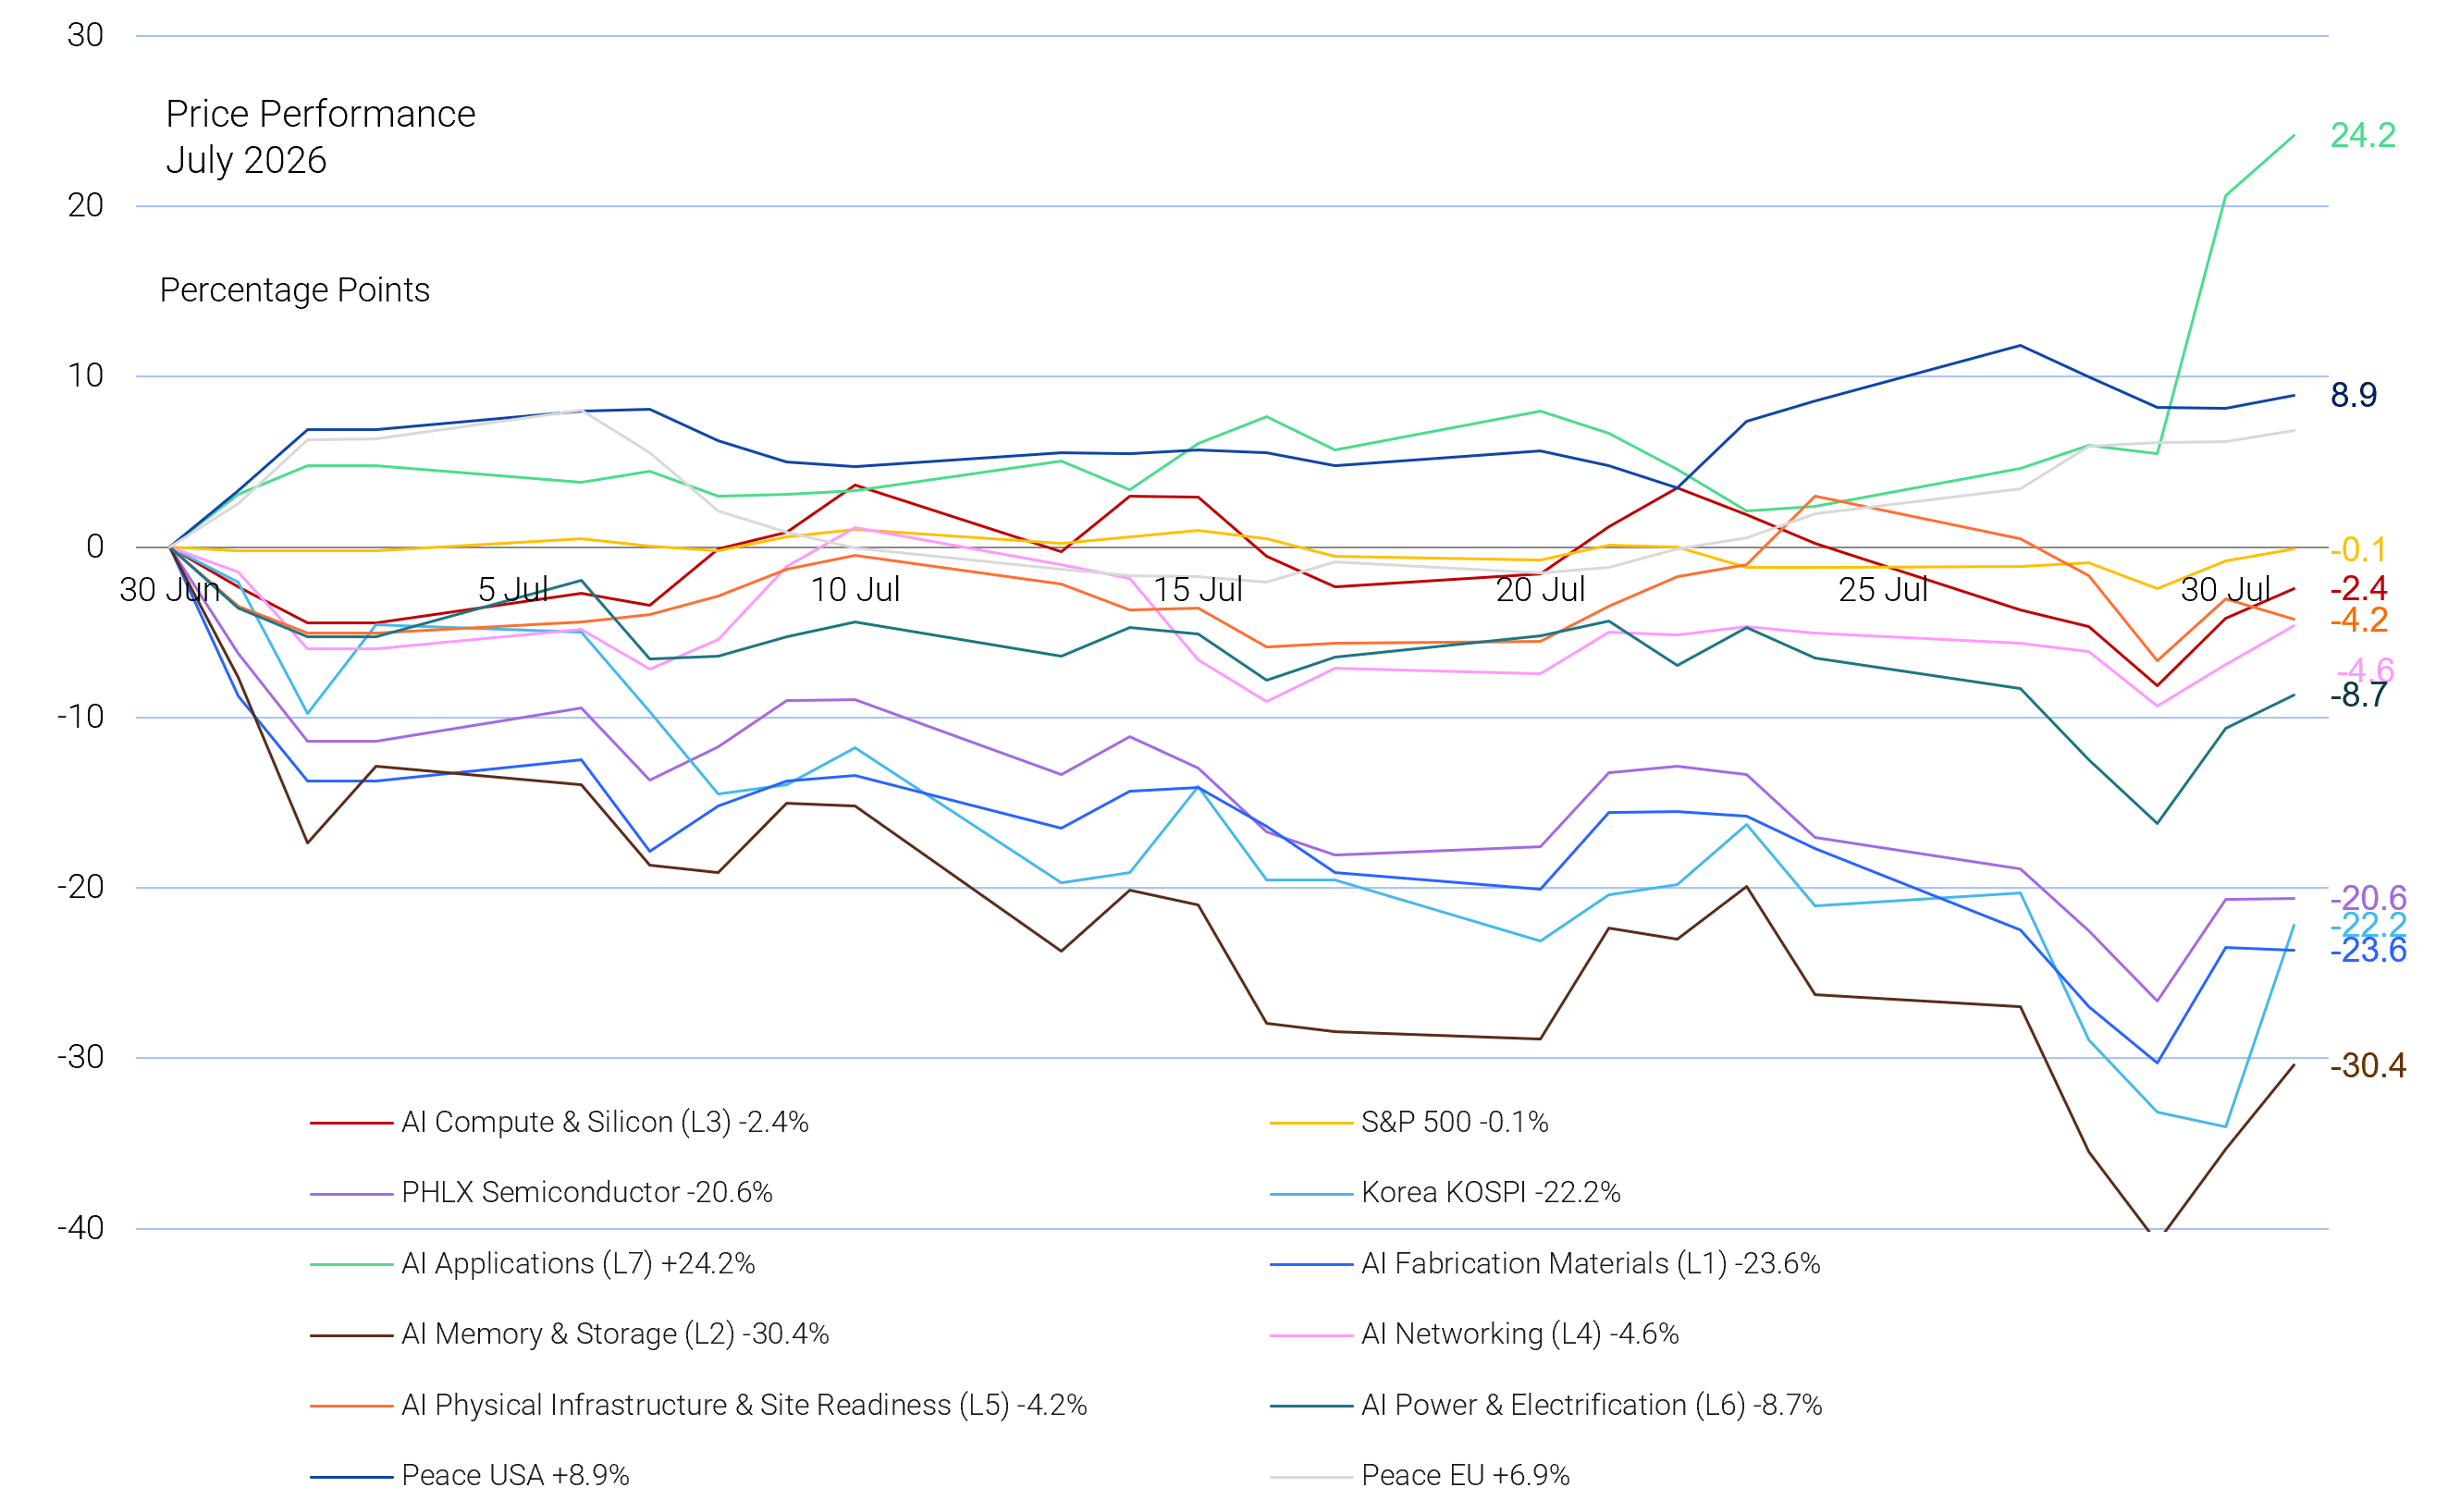
Source: FactSet
Korea's KOSPI has become a high beta AI-proxy. Few equity markets have internalised the AI cycle as directly as South Korea. The KOSPI surpassed 7,000 in May and continued to compound alongside Samsung's and SK Hynix's memory-pricing windfall, before recording its largest single-day point gain on record on 31 July, in which the index vaulted more than fourteen percent intraday. Over the July window, captured in the price-performance chart, KOSPI still finished down 22.2%, converging with the AI Memory & Storage and Fabrication Materials layers. This is evidence that Korea's index-level moves are now driven by global positioning and derivative flows around the sentiment towards the semiconductor cycle, and amplified by local leverage mechanics.
The hyperscaler CapEx referendum is transitioning from evidence to discipline. Our Equity Monthly Review in April framed the AI infrastructure thesis as having graduated from narrative to evidence. July's earnings season stress-tested that graduation against the cost of capital. Alphabet’s Q2 results, 81.8% y/o/y Google Cloud growth, a $514 billion cloud backlog, and an increased full-year CapEx guide of $195 to $205 billion, up from $180 to $190 billion, triggered a negative share-price reaction after FCF turned negative at $5.855 billion. This confirmed what we described as the CapEx clearing price. Amazon's subsequent Q2 EPS of $5.75 included a roughly $53 billion non-operating markup tied to its Anthropic stake, alone accounting for 76% of the index's net dollar-level earnings increase that week. This served as a reminder that headline beats this season have frequently reflected balance-sheet marks on AI-adjacent stakes rather than operating momentum.
The picks-and-shovels layers have, so far, offered a cleaner read. Lam Research's guided record EPS and an upwardly revised 2026 wafer-fab-equipment estimate above $150 billion, alongside Seagate's exabyte capacity pre-sold through 2027, suggested physical capacity constraints, not demand uncertainty, remain the binding limit across storage and semiconductor equipment. This was even as hyperscaler CapEx commentary showed signs of moderating sentiment. For investors, the central questions remain which layer of the AI buildout can generate FCF and over what time horizon. This is a distinction the market is now pricing with far less patience than it did in the spring.
Valuations have not kept pace with the earnings and revisions story. The index's forward price-to-earnings ratio eased through July even as prices reached records because estimates rose faster than the market. The forward earnings for the S&P 500 climbed 4.09% over the month and full-year growth expectations were revised steadily higher as the season progressed. The market has simply largely resisted paying up for the earnings beat itself. Instead, forward multiples have compressed modestly even as the index has advanced. This means this season's re-rating, where it has occurred, has been earnings-led rather than sentiment-led. This provides a constructive base, with the rally supported by fundamentals that appear firmer than in previous AI-led rallies.
At these multiples, the guide is the print. Across sectors, the season's market reactions have been governed less by beats and misses than by forward commentary. GE Aerospace raised guidance across the board against a backlog exceeding $210 billion and watched its shares decline as order growth decelerated. Netflix delivered a fundamentally sound quarter and fell 9% on a soft Q3 revenue guide. Alphabet's operational excellence was overwhelmed by a raised CapEx range and its first negative free-cash-flow quarter in five years. Microsoft was rewarded for delivering its cloud acceleration without materially lifting its CapEx outlook. At close to 20x forward earnings, the beat is assumed and incremental price action follows the forward path, not the current level. The sectors where guidance dispersion is now widest deserves particular attention: The duration of extraordinary refining margins as product inventories rebuild, the cadence of power purchase contracting among nuclear and merchant generators and the pricing architecture of the incretin franchise as channel mix broadens. In each, the range of plausible forward paths is wider than the range of trailing results, which is the condition under which guidance commands a premium over delivery.
Going into the autumn, investors will have to focus on discrimination. They will have to discriminate within the AI taxonomy, between layers where estimates and multiples agree and layers where they have violently diverged. Within the index, it will be between businesses whose cash generation funds their ambition and those borrowing against it. Across geographies, it will be between owning the theme and owning its concentration. The rotation beneath the surface is the market repricing, layer by layer, which parts of the story it still believes.
Q2 earnings in focus
So far this Q2 earnings season, 304 of the S&P 500's 503 constituents had reported results as of 31 July. The season has, thus far, been exceptional. According to FactSet, the blended Q2 earnings growth rate rose from 23.2% at quarter-end to 47.4% by 31 July, while the index's net profit margin remains on track to exceed 15%, a potential record. Yet equity performance did not fully reflect this strength. The S&P 500 ended July slightly lower. Its forward P/E multiple compressed from 20.6x to 19.7x during the month.
The proportion of companies exceeding earnings expectations is above the five-year average. In aggregate, reported earnings are 31.4% above estimates. If sustained through the full reporting season, this would represent the highest earnings surprise recorded by the index since FactSet began tracking the metric in 2008, surpassing the current record of 23.2% set in Q2 2020.
The extraordinary earnings surprise figure is primarily attributed to outsized positive EPS surprises from Alphabet and Amazon in Q2. Alphabet's reported EPS included a $98 billion gain, while Amazon's reported EPS included $53.4 billion of non-operating, pre-tax other income, primarily related to its investment in Anthropic. Excluding Alphabet and Amazon, the S&P 500's Q2 earnings surprise would fall from 31.4% to 9.2%. Nevertheless, that adjusted figure remains above both the five-year and ten-year averages.
Data compiled by LSEG I/B/E/S indicates that, as of 31 July, 60.4% of S&P 500 constituents have reported Q2 results. Of those reporting, 85.2% exceeded EPS estimates, surpassing the prior four quarter average of 80.0%, the 5-year average of 78.0%, and the 10-year average of 76.0%.
S&P 500 Earnings Growth in Q2: 47.4%
According to FactSet, the projected y/o/y earnings growth rate for Q2 2026 is 47.4%. This figure is above the 5-year average of 15.2% and above the 10-year average of 11.2%. Sector-specific analysis reveals that ten of the eleven sectors within the S&P 500 are reporting y/o/y earnings growth, led by Energy, Communication Services, Consumer Discretionary, Information Technology and Materials. Eight of these ten sectors are reporting double-digit growth. Conversely, Health Care is the only sector expected to report a y/o/y decline in earnings.
If the 47.4% growth rate is confirmed, it would represent the index's strongest quarterly earnings growth since Q2 2021, when earnings rose 91.6%. Excluding Alphabet and Amazon, the S&P 500's blended Q2 2026 earnings growth rate would decline from 47.4% to 28.8%. However, this would still mark the 2nd consecutive quarter of y/o/y earnings growth above twenty percent and the 7th consecutive quarter of double-digit growth for the index.
Energy is expected to report the highest y/o/y earnings growth rate of all eleven sectors at 135.3%. At the industry level, three of the five industries in the sector are projected to report y/o/y earnings growth above one hundred percent. The Oil & Gas Refining & Marketing industry is expected to be the largest contributor to earnings growth for the sector.
The Communication Services sector is forecast to deliver the second-highest y/o/y earnings growth, with an increase of 109.8%. At the industry level, three of the five constituent industries are anticipated to achieve earnings growth, and two of these industries are expected to achieve double-digit growth. Excluding Alphabet, the Communication Services sector would be reporting a y/o/y decline in earnings of 5.7%.
Consumer Discretionary reports the third-highest y/o/y earnings growth rate among the eleven sectors, with a 90.7% increase. At the industry level within the sector, six out of nine industries are demonstrating y/o/y earnings growth. Three industries are exhibiting double-digit growth or higher. Conversely, three industries have reported a y/o/y decline in earnings.
In contrast, the Health Care sector is projected to experience a y/o/y decline in earnings, with a decrease of 14.0%. At the industry level, two out of six industries are forecast to deliver negative earnings growth. At the company level, Gilead Sciences and Merck delivered the sector’s most pronounced negative earnings surprises. Excluding both companies, the Health Care sector would be reporting earnings growth of 11.2%.
Since 30 June, S&P 500 companies have exceeded earnings expectations by an aggregate of 31.4%. This is more than 4x the 5- and the 10-year averages of 7.3% and 7.1%, respectively, and more than 3x the average surprise factor observed in the preceding four quarters of 9.2%.
Consumer Discretionary recorded the largest positive difference between reported and estimated earnings, with an earnings surprise factor of 120.2%. At the company level, Nike delivered the most pronounced upside surprise, reporting EPS of $0.72 versus an estimate of $0.12. It was followed by Amazon, which reported EPS of $5.75 compared with an expected $1.82. As a result, the sector's blended earnings growth rate has risen sharply, from 5.0% at the end of Q2 to 90.7%.
Communication Services reported the second-largest positive difference between actual and estimated earnings, reflecting a surprise factor of 101.1%. Alphabet accounted for the sector's largest EPS surprise, reporting EPS of $9.11 against expectations of $2.88. This upside has driven the most substantial improvement in sector earnings growth since 30 June, with the expected y/o/y growth rate rising from 7.3% to 109.8%.
Financials followed with an earnings surprise factor of 14.9%. The largest contributors were Travelers Companies, Goldman Sachs and Robinhood Markets. Travelers reported EPS of $10.04 versus an expected $5.41, Goldman Sachs reported EPS of $20.98 compared with expectations of $14.51 and Robinhood reported EPS of $0.62, above the $0.43 estimate. Consequently, the sector's blended earnings growth rate has increased from 5.4% at 30 June to 20.1%.
With respect to revenue, 77.2% of S&P 500 constituents exceeded projections. This is above the 5-year average of 70.0% and the 10-year average of 67.0%. In aggregate, revenues surpassed estimates by 2.9%, higher than the 5-year average of 1.9%, the prior four quarters average surprise factor of 1.9%, and the 10-year average of 1.6%.
The blended revenue growth rate for Q2 is currently 14.1%, surpassing the 12.2% forecast at quarter-end. Since 30 June, positive revenue surprises in Energy and Health Care have been the largest contributors in the overall revenue growth rate. Should the index achieve 14.1% revenue growth for the quarter, it will signify the 23rd consecutive quarter of revenue growth, and the highest revenue growth rate recorded by the index since Q4 2021’s 16.1%.
All eleven sectors are reporting y/o/y revenue growth, led by Information Technology, Energy and Communication Services.
The forward 12-month P/E ratio of the S&P 500 stands at 20.0x, which slightly surpasses both the 5-year average of 19.9x and the 10-year average of 19.0x. The P/E ratio is currently lower than the 20.4x recorded at the end of the Q2.
S&P 500 Net Profit margin in Q2: 16.7%
The projected net profit margin for the S&P 500 in Q2 stands at 16.7%. This figure is above the net profit margin recorded in the previous quarter of 14.8%. It surpasses both the margin from the same quarter last year, which was 12.9%, and the five-year average of 12.4%. Should the net profit margin for the quarter reach 16.7%, it would represent the highest figure recorded by the index since FactSet commenced tracking this metric in 2009. The current record stands at 14.8%, which was achieved in the preceding quarter.
At the sector level, eight sectors are forecast to achieve a y/o/y increase in net profit margins in Q2 2026 compared to the same period in 2025. Leading this growth is Communication Services, with a 12.4 percentage point increase, from 15.2% to 27.6%, followed by Consumer Discretionary, with a 6.9 percentage point increase to 16.3% from 9.4%, and Information Technology, with 6.3 percentage point increase, from 25.2% to 31.5%.
There are three sectors that are reporting (or have reported) y/o/y declines in their net profit margins: Health Care, with a decrease of 1.5 percentage points, from 8.1% to 6.6%, followed by Real Estate with a 0.8 percentage point decrease to 34.1% from 34.9%, and Consumer Staples’ projected marginal decrease of 0.1 percentage points from 6.6% to 6.5%.
Nine sectors are forecast to report net profit margins in Q2 that exceed their respective five-year averages. Communication Services demonstrates the most significant improvement, attaining 27.6% compared to a five-year average of 13.0%. In contrast, three sectors are predicted to report net profit margins below their five-year averages, led by Health Care and Real Estate, expected to post margins 2.3 and 1.5 percentage points lower than their five-year averages of 8.9% and 35.6%, respectively.
Looking forward to the rest of 2026
Looking ahead, analysts forecast y/o/y earnings growth rates of 27.4% and 25.2%, for Q3 and Q4, respectively. For the entirety of calendar year 2026, analysts are anticipating a y/o/y earnings growth of 29.1%.
As of 31 July, the bottom-up target price over the next 12 months for the S&P 500 is set at 9,060.03, representing a 17.1% increase over the closing price of 7,736.52 of 4 August.
Based on the difference between bottom-up target prices and closing prices, the sectors with the most significant anticipated price appreciation are Communication Services, at 29.9%, Information Technology at 29.3% and Consumer Discretionary at 25.4%. In comparison, the smallest expected price increases are forecast for Financials, expected to increase 10.4%, Real Estate, with an anticipated rise of 10.5%, and Energy, expected to have a 12.1% increase.
Regional breakdown
US Equities
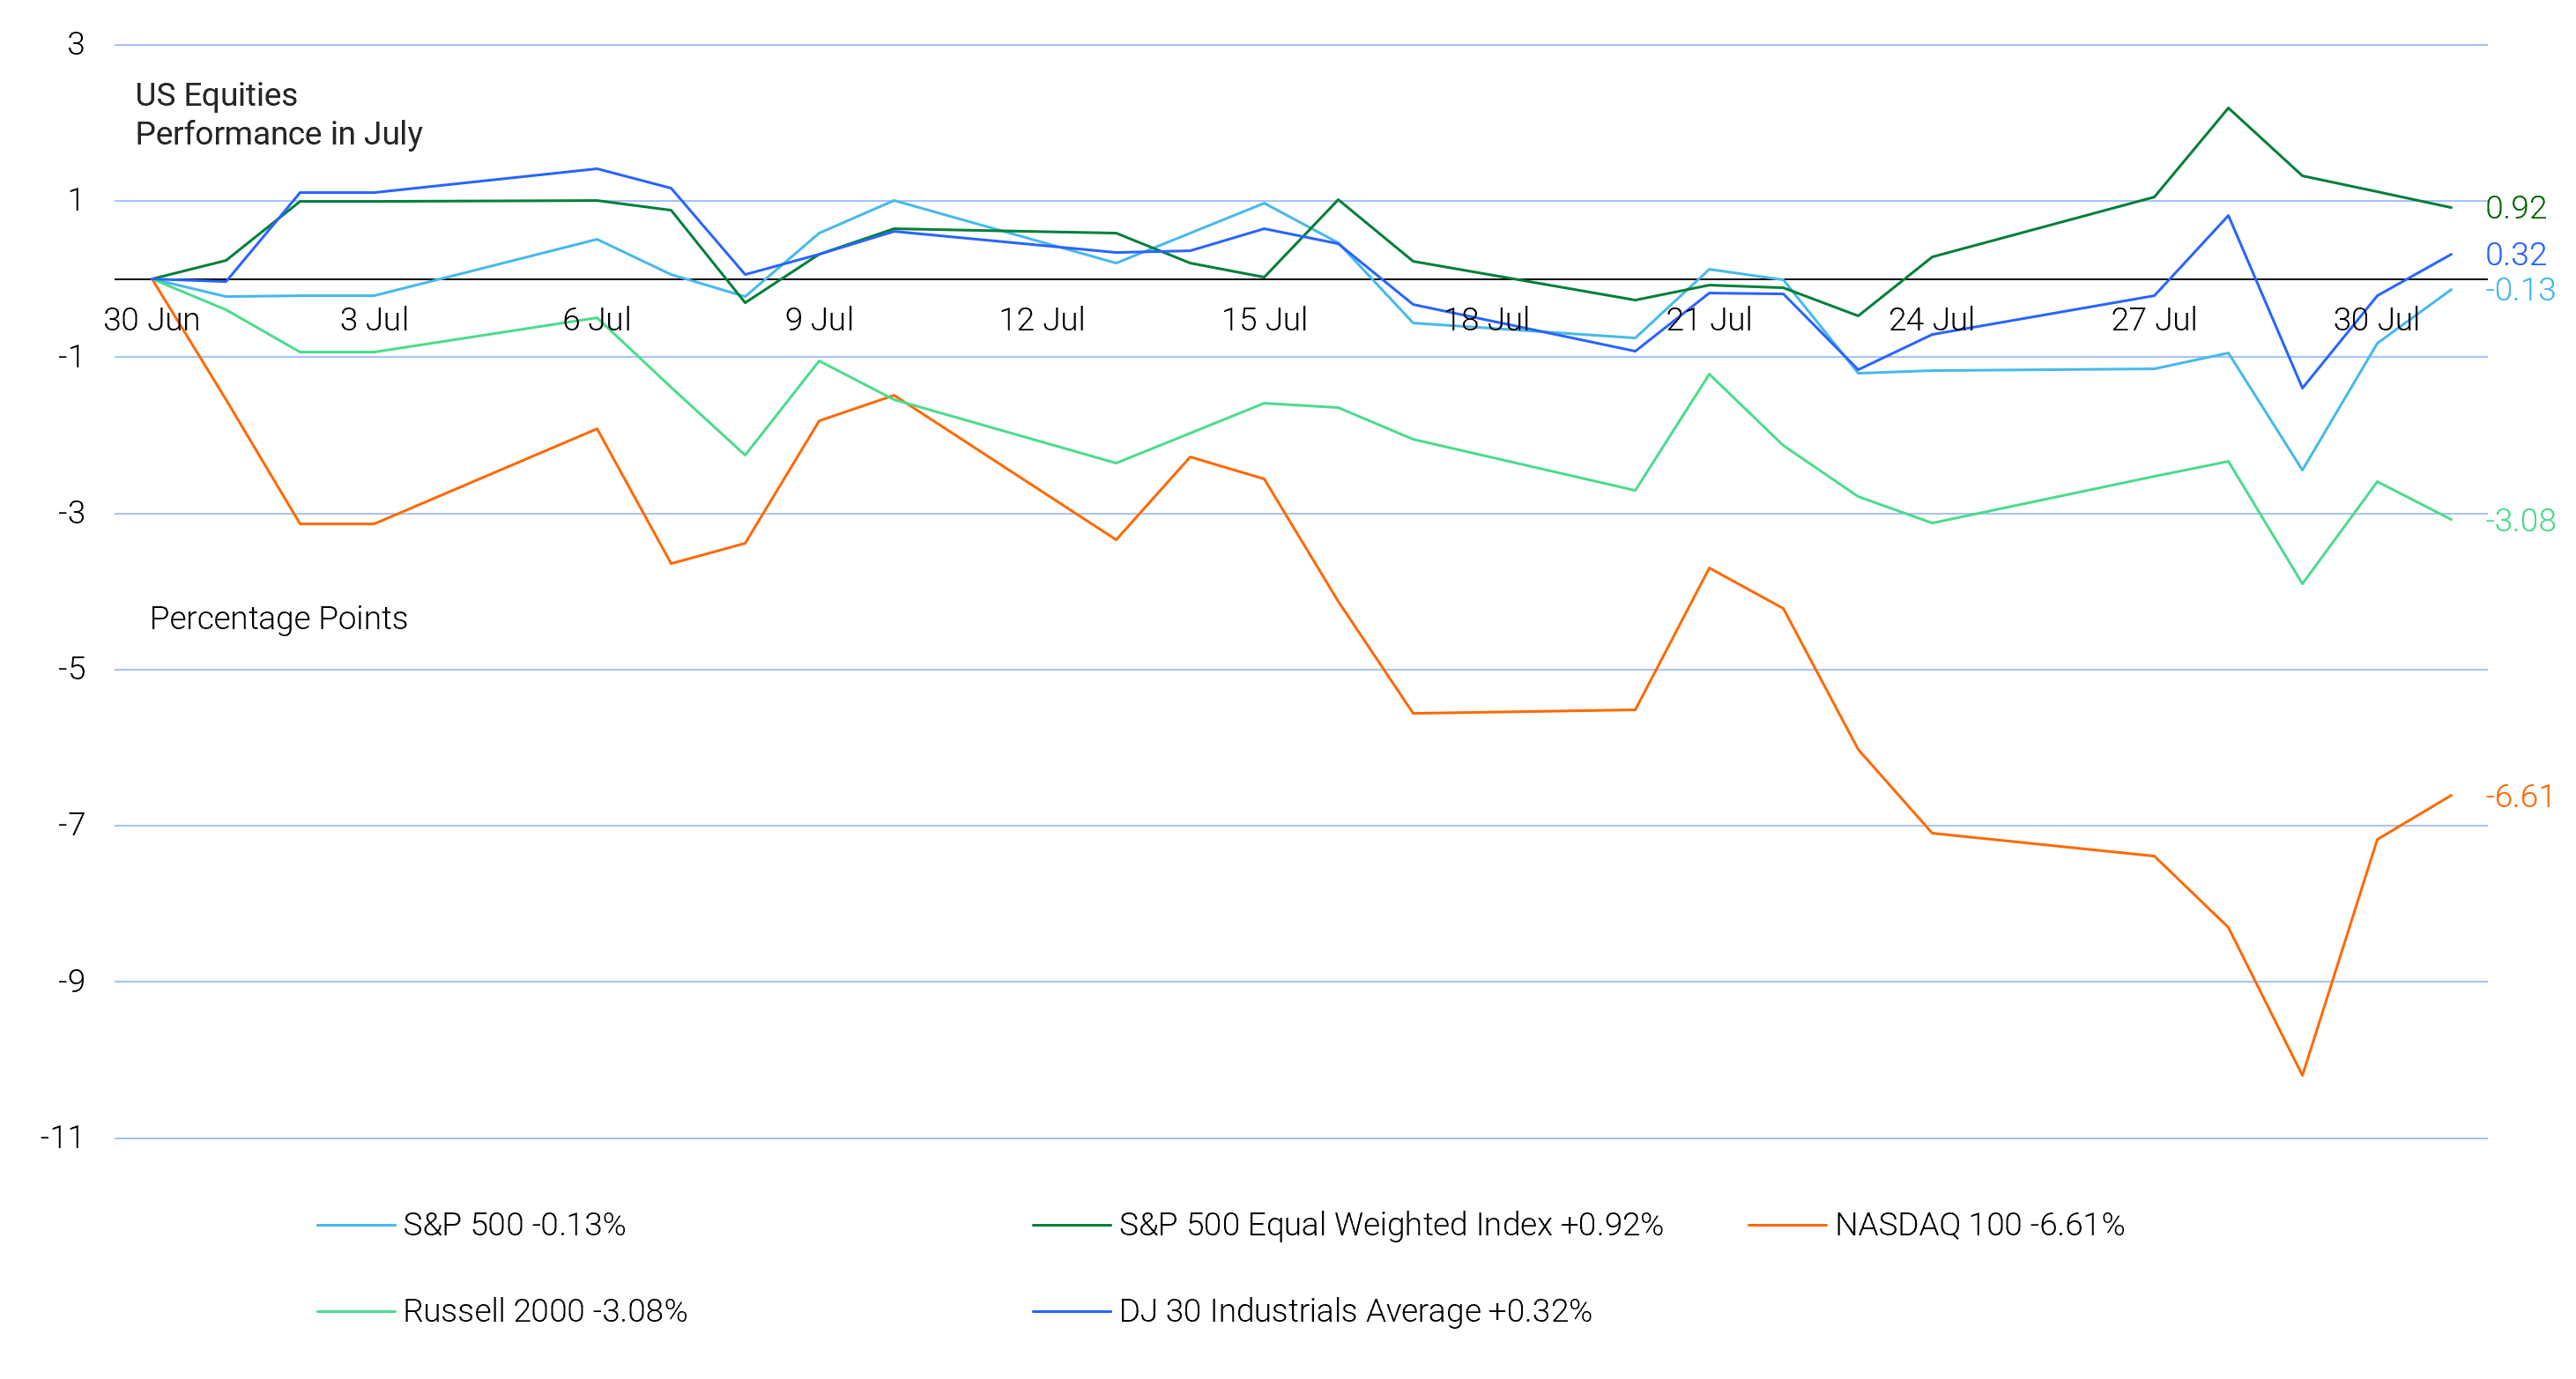
Source: FactSet
Seven of the eleven S&P 500 sectors were up in July. Energy outperformed at 12.54%, followed by Financials at 6.04% and Real Estate at 2.46%. The biggest underperformer was Information Technology, declining 3.45%, followed by Industrials at 3.06% and Utilities at 2.28%.
In July, the equal-weighted S&P 500 outperformed the benchmark by 1.05 percentage points, recording a gain of 0.92%, compared to the S&P 500's loss of 0.13%. July’s outperformance contributes to the equal-weighted version outperformance year-to-date of 1.85 percentage points.
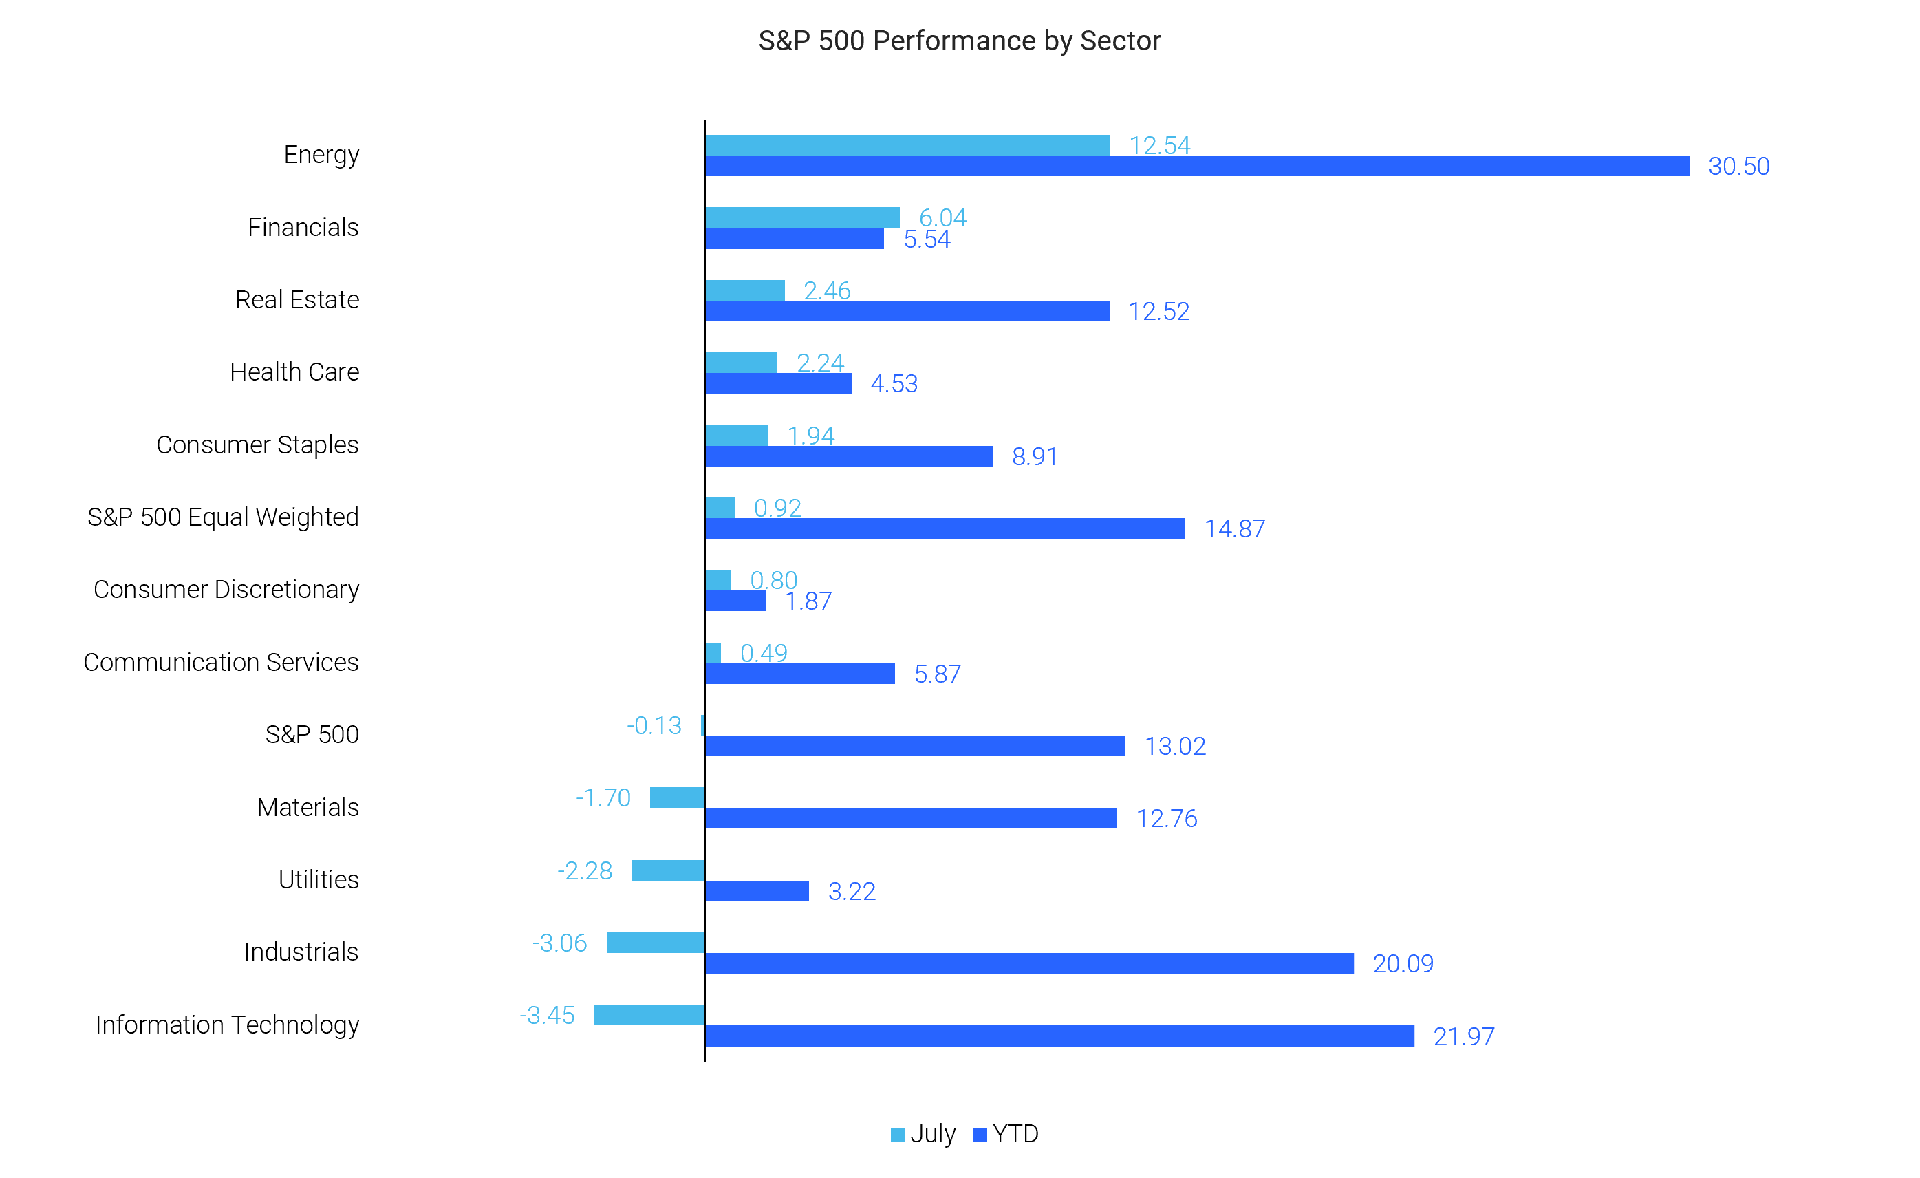
Source: FactSet
A review of the past five years (60 months) reveals that the July performance across all four major US stock indices was weak, with all indices recording monthly performance below their median. Two out of the four indices delivered results below their respective 30th percentile. The Dow Jones Industrial Average, with a performance of 0.32%, was the strongest showing among the major US equity benchmarks, positioning it at its 40.6th percentile of the past 60-month performance distribution.
The S&P 500 ranked at the 37.2nd percentile for July, with a marginal decline of 0.13%, with 38 of the previous 60 months delivering stronger results. The Russell 2000 declined 3.08%, placing it at the 27.1st percentile. The Nasdaq 100 was the weakest of the four major US indices, falling 6.61% and ranking at the 10.1st percentile, meaning only six of the past sixty months recorded a weaker performance. It was the worst performance for the Nasdaq 100 since March of last year, following Liberation Day.
European Equities
Source: FactSet
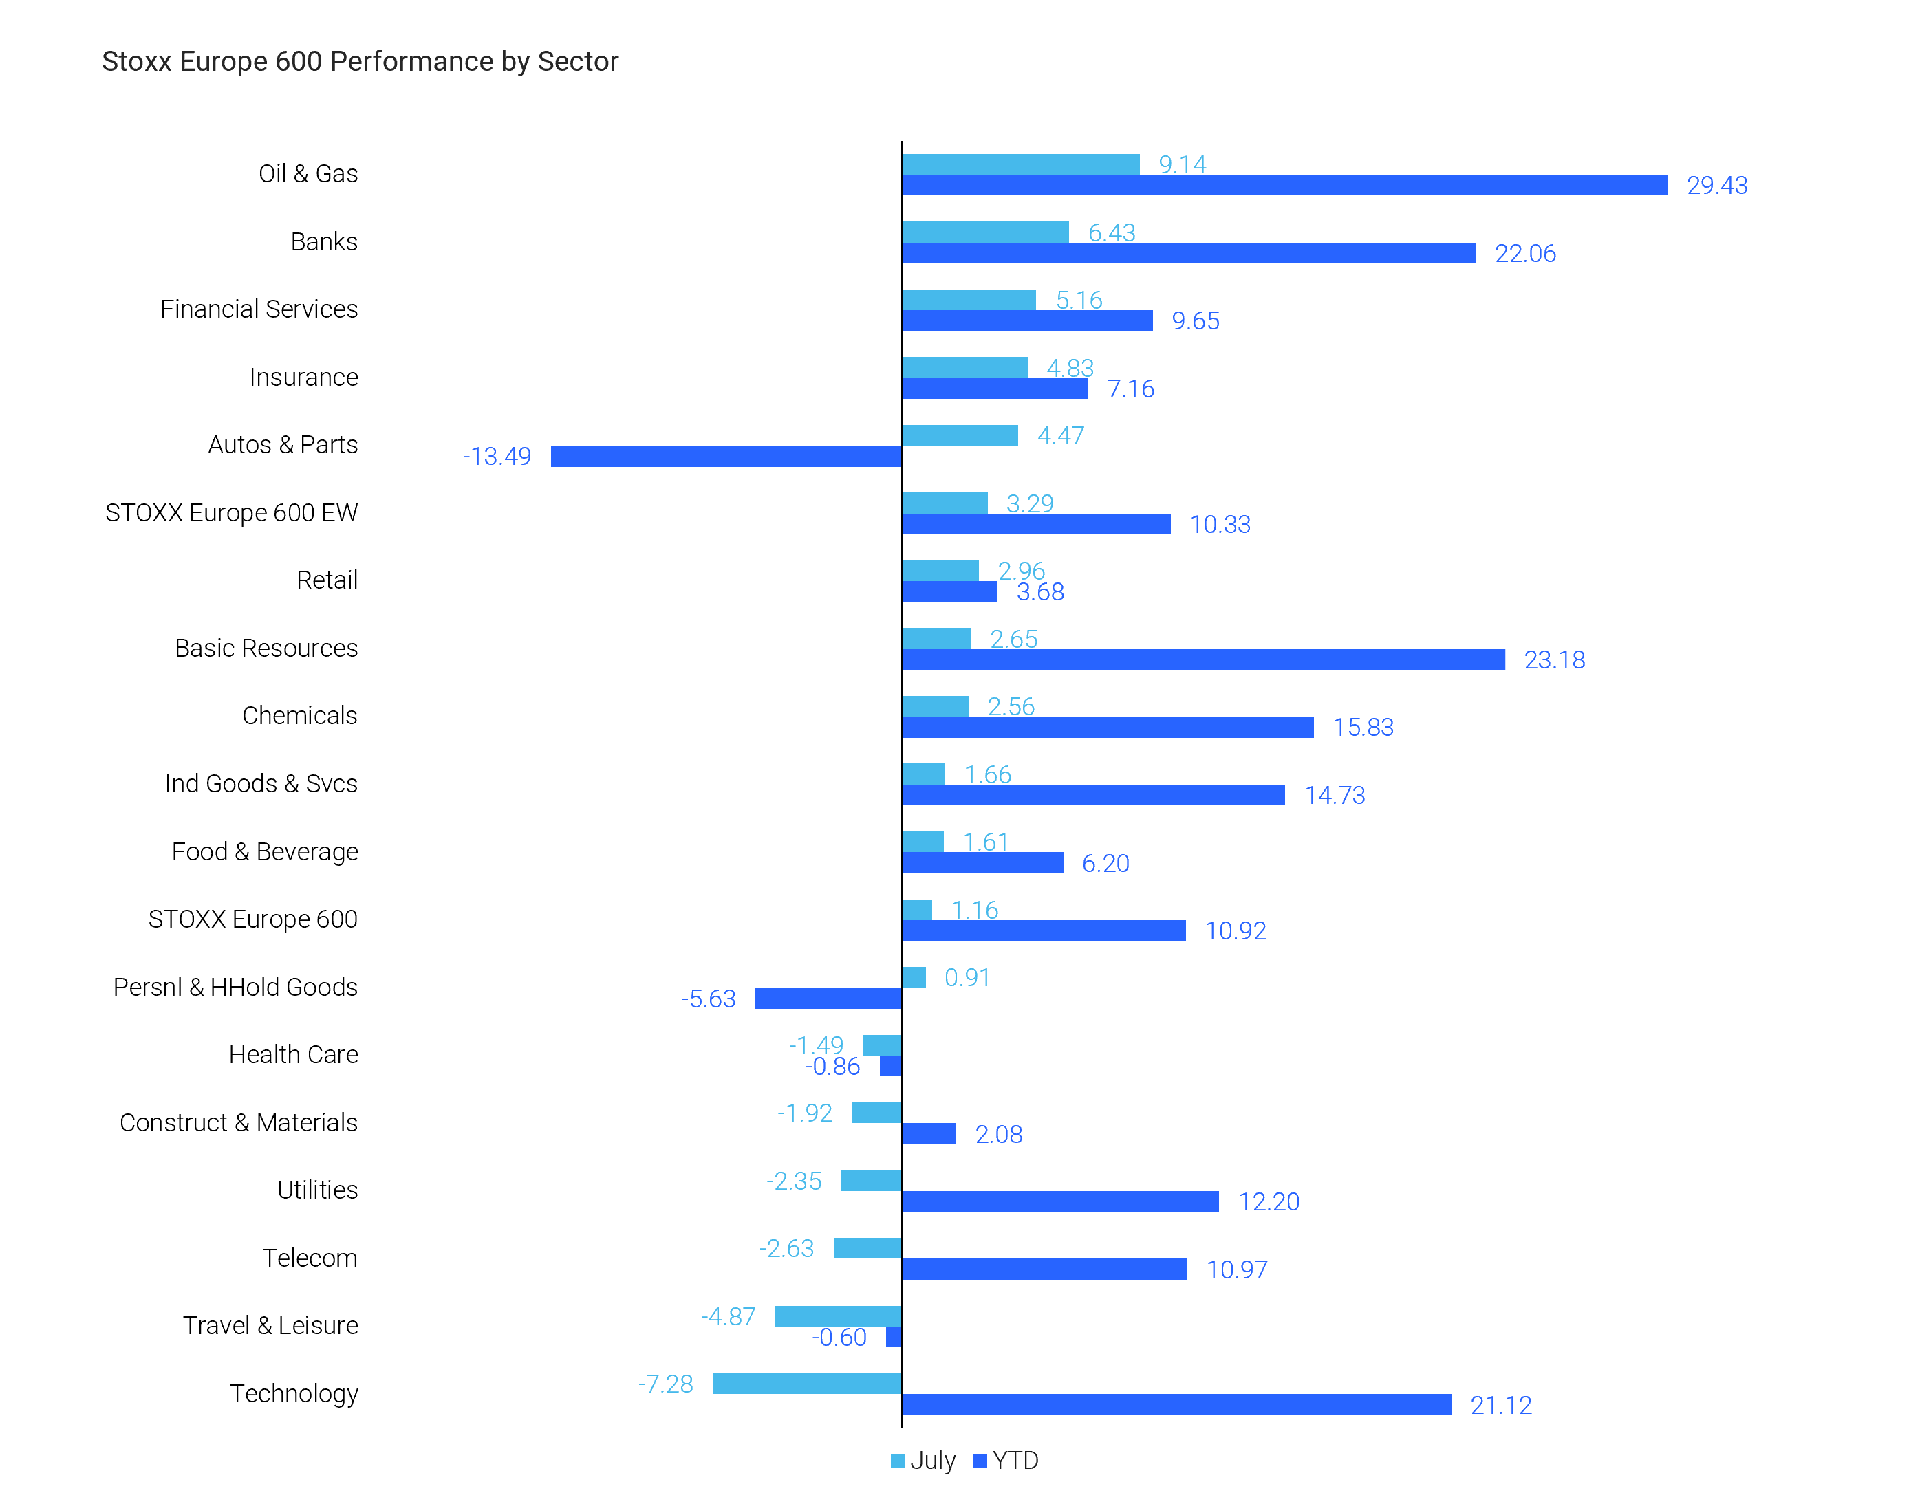
During the month of July, the Stoxx Europe 600 witnessed positive performance in 11 out of its 17 sectors. Oil & Gas outperformed within the index, advancing 9.14%, followed by Banks and Financial Services at 6.43% and 5.16%, respectively. In contrast, Technology recorded a decline of 7.28%, followed by Travel & Leisure and Telecom, down 4.87% and 2.63%, respectively.
A review of the Stoxx Europe 600 Equal Weight (EW) index provides further insight. Unlike the standard index, which is weighted by market capitalisation, the EW index assigns equal weight to each constituent. In July, it recorded a gain of 3.29%, which was 2.13 percentage points more than the standard Stoxx Europe 600's increase of 1.16%. This differential underscores the broad recovery in European markets across sectors, following the pronounced risk-off sentiment at the beginning of the month, largely driven by concerns over energy-related inflation and economic deceleration.
Source: FactSet
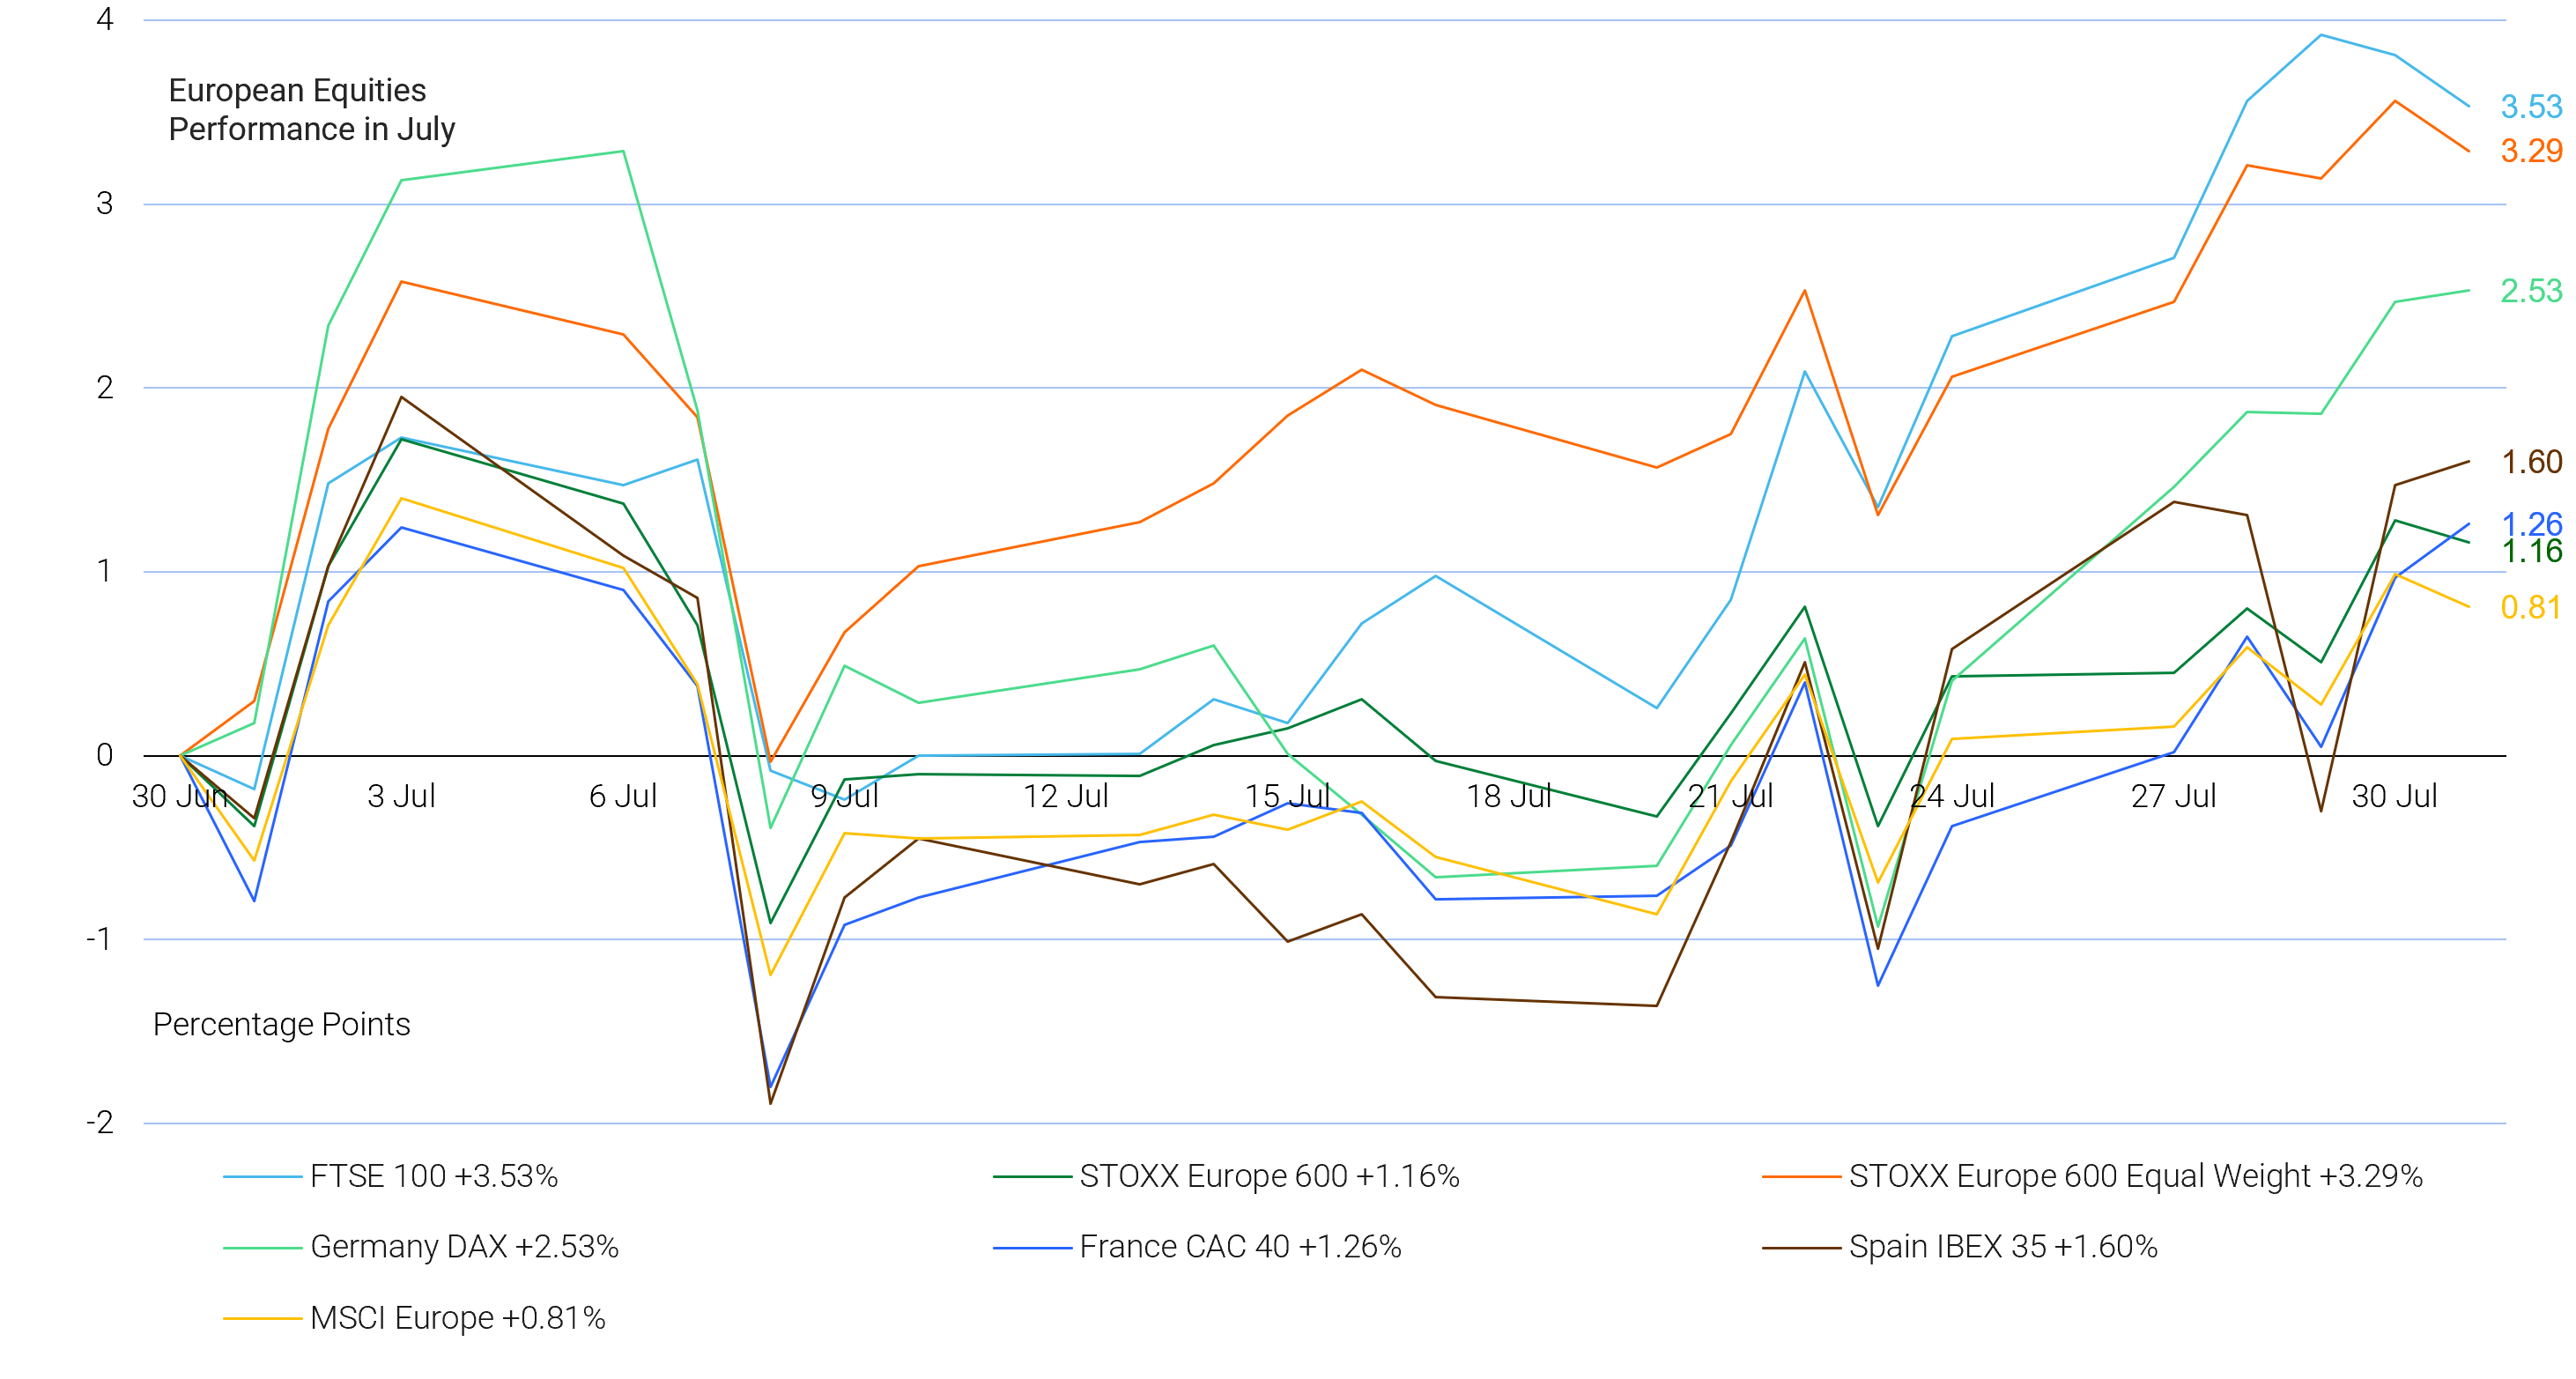
An examination of equity index performance over the past five years (60 months) indicates that the results for July rank among the most divergent monthly outcomes observed in this period for European markets. Performance across individual countries showed high divergence, with two of the six major indices recording monthly returns lower than their mean performance of their respective 60-month distributions, and one above recording a monthly return higher than its 80th percentile.
Specifically, the UK’s FTSE 100 advanced 3.53%, placing it at the 83.0th percentile of its five-year performance distribution. Both the MSCI Europe and the Stoxx Europe 600 each posted July gains that positioned them at their respective 47.4th and 49.1st percentiles, indicating that more than 30 months out of the past 60 produced stronger results.
In July, Germany’s DAX advanced 2.53%, placing it at the 66.1st percentile, indicating that twenty months out of the past sixty produced stronger results. France’s CAC 40 and Spain’s IBEX 35 also delivered positive performances, ranking at the 55.9th and 50.8th percentiles, respectively, within their individual 5-year performance distributions.
As of 30 July, according to LSEG I/B/E/S data for the Stoxx 600, Q2 2026 earnings are expected to increase 20.8% from Q2 2025. Excluding the Energy sector, earnings are projected to increase 10.3%. Q2 2026 revenue is expected to increase 11.7% from Q2 2025. Excluding the Energy sector, revenues are anticipated to increase 7.6%. Of the 176 companies in the Stoxx 600 that reported earnings for Q2 by 30 July, 56.8% reported results exceeding analyst estimates. In a typical quarter 54% beat analyst EPS estimates. Of the 225 companies in the Stoxx 600 that have reported revenue for Q2, 66.2% reported revenue exceeding analyst estimates. In a typical quarter 58% beat analyst revenue estimates.
The Stoxx 600 expects to see share-weighted earnings of €164.1 billion in Q2 compared to share-weighted earnings of €135.8 billion (based on the year-ago earnings of the current constituents) in Q2 2025. Companies are collectively reporting earnings that are 5.8% above estimates. This figure is slightly lower than the long-term average surprise factor of 5.9% observed since 2012.
Eight of the ten sectors in the index expect improved earnings compared to Q2 2025. At 130.9%, the Energy sector has the highest earnings growth rate for the quarter, while Real Estate has the highest anticipated contraction of 3.9% compared to Q2 2025.
The forward four-quarter price-to-earnings ratio (P/E) for the Stoxx 600 sits at 14.7x. This is above the 10-year average of 14.2x.
The Stoxx 600 is up 2.51% since this earnings season began on 10 July.
Analysts anticipate positive Q2 earnings growth in fourteen of the sixteen countries comprising the Stoxx 600 index. Poland, with an estimated growth rate of 119.8%, and Austria, at 76.8%, are projected to have the highest earnings growth, whereas Ireland and Denmark are expected to experience the most significant declines, estimated at 33.2% and 22.2%, respectively.
Tento článek je poskytován pouze pro informační účely a neměl by být považován za nabídku nebo výzvu k nákupu nebo prodeji jakýchkoli investic nebo souvisejících služeb, jejichž odkazy se v něm můžou vyskytovat. Obchodování s finančními nástroji je spojeno se značným rizikem ztráty a nemusí být vhodné pro všechny investory. Dřívější produktivita není spolehlivým ukazatelem budoucí produktivity.




Přihlásit se k odběru přehledů trhu
Přihlásit se k odběru
přehledů
trhu
Předplaťte si nyní Předplaťte si nyní


Založeno profesionály. Pro profesionály.
