
How will governments handle this energy shock?

Global Macro Updates
The IEA takes action but is it enough? On Wednesday the International Energy Agency (IEA) agreed to discharge 400 million barrels from emergency oil reserves to contain a price spike driven by the Middle East war. This volume far exceeds the 183 million barrels that member states released in 2022 after Russia invaded Ukraine and is the largest ever release. President Trump also indicated he would tap the US Strategic Petroleum Reserve to help ease oil prices. As noted by Bloomberg news, the Strategic Petroleum Reserve currently contains about 415 million barrels, little more than half its capacity, following a series of drawdowns by the Biden administration. Those included a record sale of 180 million barrels to help lower gasoline prices after Russia’s 2022 invasion of Ukraine.
However, potential supply losses from the war with Iran may also be much larger, with the near-stoppage of flows through the Strait of Hormuz meaning huge amounts of crude and fuels are sitting in storage facilities, unable to be delivered.
In addition, the EU is considering subsidising or cutting gas prices to “deliver relief now” following the sharp rise in European energy prices, said European Commission president Ursula von der Leyen. This followed Shell declaring force majeure on some liquefied natural gas deliveries to Asia, meaning the shipments would not be fulfilled.
This geopolitical turmoil has resulted in sharp increases in oil and gas prices, heightening fears of a renewed inflationary shock. At the EU level, policymakers are reportedly contemplating the introduction of a cap on natural gas prices in an effort to mitigate the impact on electricity bills.
On a national scale, several targeted interventions are being implemented: Germany intends to restrict fuel stations to a single price adjustment per day, while Greece is set to impose temporary caps on profit margins for fuel and grocery retailers. Italy is considering redistributing additional VAT revenues, which have increased as a result of rising fuel prices, directly to households and is enhancing measures to prevent price gouging. Austria is extending its strategic gas reserves, expediting the introduction of household power price caps, and placing restrictions on fuel price increases. In France, authorities are closely monitoring fuel markets for irregular pricing practices, whereas countries such as Poland and the Czech Republic are advocating for a relaxation of EU carbon pricing regulations to help reduce industrial costs.
However, markets may be exhibiting a degree of complacency, assuming that the disruption in energy supplies by the Middle East will prove temporary. Should oil prices remain elevated for a prolonged period, Europe could face a persistent risk of stagflation, marked by weaker economic growth due to supply chain disruptions, higher input costs, higher food inflation as fertiliser prices rise in response to the supply shock, and tighter monetary policy.
Is the Fed stuck? February's CPI print was in line with expectations, headline at 2.4% y/o/y, core at 2.5% y/o/y, offering a snapshot of an economy where underlying price pressures had been quietly moderating before the Middle East escalation upended the outlook. Shelter remained the largest contributor to the monthly 0.3% increase, while energy rose 0.6% and food accelerated to 0.4%. Under normal circumstances, this would be a reassuringly benign report. But as multiple strategists noted, February's data is already obsolete: gasoline prices have surged roughly 19% in two weeks, and each additional $10 in crude adds approximately 0.2 percentage points to CPI. The numbers investors will trade are March's, not February's.
The bond market has already moved on. Two-year inflation breakevens have surged from roughly 2.5% to above 3.2% since the onset of hostilities, a 70 bps repricing that reflects traders piling into TIPS and inflation swaps as oil rips higher. The move in shorter-dated breakevens has been far more violent than in longer tenors, 30-year TIPS breakevens remain around 2.2%, mirroring the same front-loaded risk premium visible in crude futures. According to Bloomberg news, ING noted that ‘US breakeven inflation and swap spreads are on the march wider,’ while swaps pricing now implies central banks globally may need to tighten faster than previously expected. The market-implied timing of the Fed's first rate cut has been pushed from June to October.
This creates a vicious feedback loop. Higher rate expectations have propelled the dollar to its strongest levels of the year, compressing the euro to near $1.15 and pressuring Emerging market (EM) currencies. A stronger dollar, in turn, acts as an organic tightening of financial conditions: it raises the real cost of dollar-denominated debt for EM borrowers, squeezes commodity-importing nations already reeling from the oil shock, and weighs on US multinational earnings at precisely the moment when domestic demand is faltering. The reflexive danger is that dollar strength begets further risk-off positioning, which begets more safe-haven flows into the greenback, tightening conditions further without the Fed lifting a finger.
That tightening lands on an economy with almost no labour-market cushion. Fed Governor Waller warned in January that 2025 payroll revisions would likely show zero job growth, and February's report delivered a 92,000-job decline, the third negative print in five months. Private-sector payrolls fell 86,000; outside of Healthcare and Government (themselves now shrinking) job creation has been essentially nonexistent since April. Unemployment has risen to 4.4%, and the participation rate has fallen to 62.0%, its lowest since December 2019. In February, according to Fortune, Waller himself called this ‘the first time in my career’ that he had seen an economy growing with zero job creation.
The Fed is thus caught in a textbook stagflationary bind. Inflation expectations are being pulled higher by an energy shock the central bank cannot control, while a deteriorating labour market argues for easier policy. Bloomberg's Jonathan Levin argued that today's Fed is likely to ‘look through’ supply-driven energy volatility rather than hike into weakness, noting that only 15% of the CPI basket is currently inflating above 4%, compared with 62% when Russia invaded Ukraine. But looking through a shock and being perceived as tolerating one are different things, and if breakevens continue to widen, the Fed's credibility premium could erode, forcing a hawkish posture that accelerates the very demand destruction already underway.
Global market indices
US Stock Indices Price Performance
Nasdaq 100 +0.02% MTD and -1.13% YTD
Dow Jones Industrial Average -3.19% MTD and -1.34% YTD
NYSE -4.29% MTD and +2.20% YTD
S&P 500 -1.50% MTD and -1.02% YTD
The S&P 500 is -1.36% over the past seven days, with 9 of the 11 sectors down MTD. The Equally Weighted version of the S&P 500 is -3.19% over this past week and +2.31% YTD.
The S&P 500 Information Technology is the leading sector so far this month, +1.87% MTD and -3.84% YTD, while Materials is the weakest sector at -7.31% MTD and +9.04% YTD.
Over the past seven days, Energy outperformed within the S&P 500 at +0.83%, followed by Information Technology and Communication Services at +0.74% and -0.32%, respectively. Conversely, Materials underperformed at -4.28%, followed by Industrials and Financials at -3.71% and -3.24%, respectively.
The equal-weight version of the S&P 500 was -0.32% on Wednesday, underperforming its cap-weighted counterpart by 0.24 percentage points.
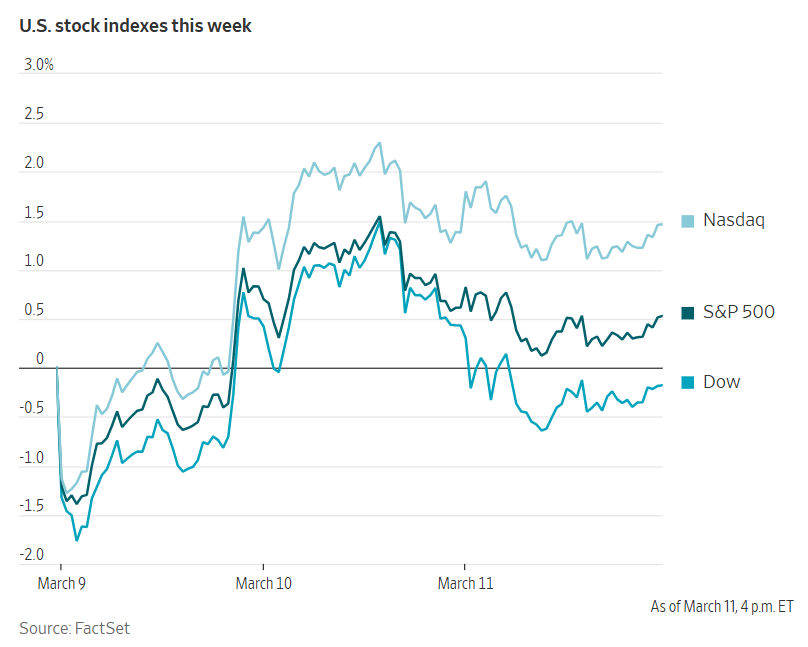
Equities experienced a brief rally in the late morning following the International Energy Agency's announcement; however, these gains dissipated by midday.
The Dow Jones Industrial Average declined -0.61% to close at 47,417 points, marking its lowest finish since 1st December. The S&P 500 edged down -0.08%, while the Nasdaq Composite posted a modest gain of +0.08%. Over the past seven days, the S&P 500 is -0.80%, the Dow Jones -1.12%, and the Nasdaq Composite -1.32%.
In corporate news, JPMorgan has reduced the valuation of collateral held by private credit firms, thereby curbing their borrowing capacity.
According to its CFO, KKR’s publicly traded private credit fund is facing pressures on near-term returns.
Chubb has been designated as the lead insurance underwriter for tankers navigating the Strait of Hormuz.
Campbell's has revised its profit outlook downward to the lowest level in a decade, attributing the adjustment to sluggish snack sales.
McDonald’s intends to introduce new menu offerings in April, each priced at $3 or less.
Mega caps: The Magnificent Seven had a mixed performance over the past week. Over the last seven days, Alphabet +2.60%, Nvidia +1.63%, and Tesla +0.56%, while Microsoft -0.08%, Apple -0.65%, Amazon -1.92%, and Meta Platforms -1.93%.
Energy stocks had a positive performance this week. The Energy sector itself was +0.83%. WTI and Brent prices are +35.01% and +27.87%, respectively, over the past week. Over the last seven days, APA +6.01%, Chevron +3.09%, Occidental Petroleum +3.67%, Shell +5.89%, BP +6.81%, Phillips 66 +2.90%, ExxonMobil +1.17%, Marathon Petroleum +4.32%, ConocoPhillips +1.19%, and Halliburton +4.36%, while Baker Hughes -2.03% and Energy Fuels -8.33%.
Materials and Mining stocks had a mixed performance this week, with the Materials sector itself -4.28%. Over the past seven days, CF Industries +14.73%, Mosaic +12.07%, Yara International +4.71%, and Celanese Corporation +1.54%, while Nucor -0.17%, Albemarle -0.21%, Freeport-McMoRan -1.79%, Newmont Corporation -2.65%, and Sibanye Stillwater -7.12%.
European Stock Indices Price Performance
Stoxx 600 -4.94% MTD and +1.75% YTD
DAX -6.50% MTD and -3.47% YTD
CAC 40 -6.28% MTD and -1.32% YTD
IBEX 35 -5.49% MTD and +0.25% YTD
FTSE MIB -5.16% MTD and -0.38% YTD
FTSE 100 -5.10% MTD and +4.25% YTD
This week, the pan-European Stoxx Europe 600 index is -1.66%. It was -0.59% Wednesday, closing at 602.54.
So far this month in the STOXX Europe 600, unsurprisingly, Oil & Gas is the leading sector +4.36% MTD and +23.82% YTD, while Autos & Parts is the weakest at -9.16% MTD and -10.63% YTD.
Over the past seven days, Oil & Gas outperformed within the STOXX Europe 600, at +4.07%, followed by Technology and Utilities at +0.43% and -0.20%, respectively. Conversely, Construction & Materials underperformed at -4.10%, followed by Health Care and Autos & Parts at -3.80% and -3.71%, respectively.
Germany's DAX index was -1.37% Wednesday, closing at 23,640.03. It was -2.34% over the past seven days. France's CAC 40 index was -0.19% Wednesday, closing at 8,041.81. It was -1.54% over the past week.
The UK's FTSE 100 index was -2.02% over the past seven days to 10,353.77. It was -0.56% on Wednesday.
The retail sector outperformed on Wednesday, highlighted by Inditex, which reported robust Q1 results and continued y/o/y growth across its brands. Nordic retailer Clas Ohlson also exceeded EBIT forecasts, benefitting from improved gross margins and reduced freight costs. The Autos & Parts segment advanced on optimism surrounding restructuring efforts; Porsche detailed cost-cutting and organisational streamlining plans after a challenging year, and Renault rallied following the introduction of its ‘futuREady’ strategy, aiming for a medium-term operating margin of 5% - 7%.
The Oil & Gas sector recorded modest gains as crude prices remained elevated, driven by persistent tensions around the Strait of Hormuz and concerns over the escalating regional conflict, despite mixed messages from the US President earlier in the week. Upstream and shipping-related companies also traded higher, with NorAm Drilling advancing on positive operational updates.
Although Travel & Leisure declined, it remained a relative outperformer, supported by bargain-hunting after recent declines. Operators tied to travel demand experienced modest recoveries despite ongoing concerns about rising fuel costs, with numerous reports suggesting that global airlines are expected to increase airfares. The banking sector was supported by expectations of further rate hikes from the ECB and M&A activity, as Italian lenders Banca Monte dei Paschi di Siena and Mediobanca advanced following the approval of a merger plan that could reshape Italy’s banking landscape.
Industrial Goods & Services was the session’s weakest performer, with the defence industry leading losses. Rheinmetall declined after its sales growth outlook disappointed, despite a record order backlog and anticipated missile restocking demand linked to the Iran conflict. Basic Resources retreated amid commodity price volatility and concerns over supply chain disruptions. Gerresheimer shares fell sharply due to governance issues after it postponed full-year results pending an audit investigation, while Henkel declined as weaker Q4 results from Adhesive Technologies offset robust performance in its Consumer Brands division.
Financial Services also traded lower, with Legal & General declining after missing annual profit expectations. CVC Capital Partners fell on downbeat earnings and lower fee expectations from private equity disposals, while Eurazeo was weighed down by its latest assets under management figures.
Other Global Stock Indices Price Performance
MSCI World Index -3.23% MTD and -0.10% YTD
Hang Seng -2.75% MTD and +1.05% YTD
Over the past seven days, the MSCI World Index and Hang Seng Index are +2.57% and -1.37%, respectively.
Currencies
EUR -2.06% MTD and -1.46% YTD to $1.1573
GBP -0.58% MTD and -0.49% YTD to $1.3407
The US dollar strengthened against both the euro and the yen on Wednesday. The dollar index was +0.33% to 99.25. Over the week, the dollar index was +0.48% higher. The dollar index is +1.64% MTD and +0.99% YTD.
Since the end of February, the dollar has appreciated by +2.06% against the euro, with a further gain of +0.28% recorded on Wednesday. The euro has declined -0.52% over the past seven days.
The dollar rose +0.49% against the Japanese yen on Wednesday, reaching ¥158.85. It is +1.16% over the past seven days, +1.79% MTD and +1.40% YTD.
In contrast, the British pound edged -0.01% lower to $1.3407 amid a volatile session shaped by concerns over a potential oil supply shock. Over the past seven days, sterling has strengthened by +0.36% against the greenback. Oxford Economics projected that UK inflation could increase by 0.4 percentage points should shipping through the Strait of Hormuz be disrupted for up to two months. The increase in inflationary pressures has greatly reduced the likelihood of the Bank of England cutting rates at its March meeting despite lackluster growth and a weakening jobs market.
Note: As of 5:00 pm EDT 11 March 2026
Cryptocurrencies
Bitcoin +8.08% MTD and -19.31% YTD to $70,762.89
Ethereum +7.93% MTD and -30.38% YTD to $2,073.59
Bitcoin was -3.52% over the last seven days and Ethereum was -3.58%. On Wednesday, Bitcoin was +1.40% to $70,762.89. Ethereum was +2.15% to $2,073.59.
Despite a positive performance on Wednesday due to rising concerns around inflation and the ability of the Fed to cut rates, Bitcoin and Ethereum were down for the week as increasing geopolitical tensions are complicating the outlook for markets and policymakers. However, since the start of the US - Israel-led war with Iran, Bitcoin and Ethereum have outperformed gold and equity markets with some analysts citing the fact that cryptocurrencies can be traded at any time and are not beholden to regular banking hours like traditional stocks.
The rise in crypto prices comes as the US Securities and Exchange Commission (SEC) and the Commodity Futures Trading Commission (CFTC) signed a memorandum of understanding (MoU) intended to guide coordination and collaboration to support lawful innovation, uphold market integrity, and ensure investor and customer protection. SEC Chairman Paul Atkins said in a statement that ‘this updated Memorandum of Understanding will serve as a roadmap for a new era of harmonisation between the agencies – one that is critical to support US leadership in this next chapter of financial innovation. By aligning regulatory definitions, coordinating oversight, and facilitating seamless, secure data sharing between agencies, we will ensure our rules and regulations deliver the clarity market participants deserve.’ One of the priorities of the MoU includes developing federal policy that provides a “fit-for-purpose regulatory framework for crypto assets.”
Note: As of 5:00 pm EDT 11 March 2026
Fixed Income
US 10-year yield +27.9 bps MTD and +5.9 bps YTD to 4.231%
German 10-year yield +28.4 bps MTD and +8.0 bps YTD to 2.940%
UK 10-year yield +27.1 bps MTD and +14.9 bps YTD to 4.627%
Two-year Treasury yields surged to a five-month high on Wednesday, as escalating oil prices intensified concerns regarding inflation.
The yield on the two-year note, which often reflects expectations for changes in the Fed funds rate, climbed +5.0 bps to 3.661%. Earlier in the session, it reached 3.648%, marking the highest level since 26th September.
The yield on the 10-year US Treasury note increased +6.7 bps to 4.231%, after touching 4.226%, its peak since 9th February. On the longer end of the yield curve, the 30-year yield advanced +8.9 bps to 4.885%.
The spread between two- and 10-year note yields steepened to 57.0 bps, which is 2.2 bps wider than the previous week’s 54.8 bps.
Demand was subdued for the Treasury’s $39 billion auction of 10-year notes, the second of three coupon-bearing offerings totalling $119 billion scheduled this week. The 10-year notes were sold at a high yield of 4.217%, which was 0.5 bps higher than the pre-auction trading level. The bid-to-cover ratio stood at 2.45x, a modest improvement from February’s 2.39x, then the weakest result since August.
Similarly, the government’s $58 billion sale of three-year notes on Tuesday attracted limited interest. An additional $22 billion in 30-year bonds is set to be offered on Thursday.
Over the past week, at the front-end of the curve, the 2-year yield increased +10.5 bps, the 10-year yield advanced +12.7 bps and at the longer end, the 30-year yield was +14.0 bps higher.
Expectations for a rate cut by the Fed have continued to fall this week due to the rise in oil prices. According to CME Group's FedWatch Tool, Fed funds futures traders are now pricing in a 0.6% probability of a 25 bps rate cut at next week’s March’s FOMC meeting, from 1.7% last week. However, the probability of a rate cut at the June meeting has risen to 33.8% from last week’s 30.2%.
Across the Atlantic, in the UK, on Wednesday the 10-year gilt was +12.9 bps to 4.627%. Over the past seven days, it was +25.1 bps.
On Wednesday, eurozone government bond yields rose, although they remained below the peaks reached earlier in the week. Investors closely tracked the fluctuations in oil prices amid ongoing geopolitical tensions on the twelfth day of the US-Israeli conflict with Iran. Money markets continued to anticipate a potential interest rate hike by the ECB this year, marking a notable shift from the marginal probability of a rate cut prior to the outbreak of conflict.
Germany's 10-year bond yield increased +10.0 bps, reaching 2.940%. Germany's 2-year bond yield, most responsive to ECB policy expectations, rose +11.7 bps to 2.377%. On Monday, it reached its highest level since August 2024 at 2.476%. The 30-year yield advanced +4.9 bps to 3.494%.
Italian bond yields were volatile, a trend attributed by analysts to the nation’s greater dependence on oil and natural gas imports. Italy’s BTP 10-year bond yield climbed +13.0 bps to 3.663%, though it stayed well below Monday’s 11-month high of 3.785%.
French OAT 10-year yield was +11.5 bps to 3.568%.
Over the past seven days, the German 10-year yield is +18.3 bps. Germany's two-year bond yield is +22.7 bps, while Germany's 30-year yield is +9.5 bps.
The yield spread between German Bunds and 10-year UK gilts reached 168.7 bps on Wednesday, a rise of 6.8 bps over the past seven days.
The spread between US 10-year Treasuries and German Bunds is now 129.1 bps, 5.6 bps narrower from last week’s 134.7 bps.
The spread between Italian BTP 10-year yields and German Bund 10-year yields widened by 4.5 bps to stand at 72.3 bps. The Italian 10-year yield was +22.8 bps over the last week.
Over the course of the week, France’s 10-year yield has risen +21.0 bps. The spread between the French OAT 10-year yield and German Bund 10-year yield stood at 62.8 bps, 2.7 bps more than last week’s 60.1 bps.
Commodities
Gold spot -2.29% MTD and +19.97% YTD to $5,175.45 per ounce
Silver spot -9.12% MTD and +20.38% YTD to $85.79 per ounce
West Texas Intermediate crude +35.01% MTD and +58.25% YTD to $90.85 a barrel
Brent crude +27.89% MTD and +53.72% YTD to $93.63 a barrel
Gold prices declined modestly on Wednesday, pressured by a strengthening US dollar. Spot gold slipped -0.31% to $5,175.45 per ounce, retreating after gains posted in the prior session. Over the last seven days, spot gold prices have advanced +0.70%. Spot gold is -2.29% MTD and +19.97% YTD.
The US dollar index advanced +0.33%. A firmer dollar typically renders dollar-denominated commodities more expensive for investors holding other currencies.
Spot silver also declined on Wednesday, falling -2.96% to $85.79 per ounce. Over the last week, spot silver prices have increased by +1.51%. Spot silver is -9.12% MTD and +20.38% YTD.
On Wednesday oil prices surged, driven by renewed attacks on vessels in the Straits of Hormuz. Brent crude futures advanced $2.23, or +2.44%, closing at $93.63 per barrel. WTI settled $2.54 higher, or +2.88%, at $90.85 per barrel. Over the last seven days, WTI is +35.01% and Brent is +27.89%.
According to maritime security and risk management firms, three additional vessels were struck by projectiles in the Strait of Hormuz on Wednesday, raising the total number of ships hit in the region to at least fourteen since the onset of the conflict with Iran.
Shipping activity through the narrow strait has slowed to nearly a standstill since the United States and Israel began military actions against Iran on 28th February, effectively halting exports of roughly one-fifth of the world's oil supply and pushing global oil prices to their highest levels since 2022.
In response to these supply concerns, the IEA has recommended the release of 400 million barrels of oil, a move unprecedented in scale, in an effort to curb energy prices. The exact timeline for this release is expected to be determined in due course.
This proposed release surpasses the 182 million barrels made available in 2022 following Russia’s invasion of Ukraine. Nevertheless, analysts contend that even this record volume would fall short of offsetting the supply losses likely to result from a protracted conflict in the Middle East.
Estimates suggest that the release would equate to approximately four days of global oil production and roughly sixteen days of the crude volume that typically transits the Gulf.
Iran has continued to target energy interests throughout the Gulf. The US reported striking over a dozen Iranian mine-laying vessels; however, reports remain mixed regarding whether any mines have been deployed in the Strait of Hormuz. At least three ships sustained damage from drone or missile attacks overnight, and a drone strike targeted an oil storage facility at the Port of Salalah in Oman.
The latest OPEC Monthly Oil Market Report indicated that, despite recent developments in the Middle East, estimates for global demand growth and non-OPEC supply growth for 2026 and 2027 remain unchanged. OPEC refrained from directly addressing the conflict in Iran, opting instead to reference ‘geopolitical developments’ and ‘supply disruptions.’
EIA report. The latest US Energy Information Agency (EIA) report released on Wednesday showed that US crude oil refinery inputs averaged 16.2 million barrels per day during the week ending 6 March. This was 328 thousand barrels per day more than the previous week’s average. Refineries operated at 90.8% of their operable capacity last week. Gasoline production increased last week, averaging 9.9 million barrels per day, while distillate fuel production increased by 131 thousand barrels per day last week, averaging 4.9 million barrels per day.
However, US crude oil imports averaged 6.4 million barrels per day last week, an increase of 98 thousand barrels per day from the previous week. Over the past four weeks, crude oil imports averaged about 6.5 million barrels per day, 12.6% more than the same four-week period last year. Most importantly, US commercial crude oil inventories (excluding those in the Strategic
Petroleum Reserve) increased by 3.8 million barrels from the previous week. Yet, at 443.1 million barrels, US crude oil inventories are about 2% below the five year average for this time of year.
Although total motor gasoline inventories decreased by 3.7 million barrels from last week, they are 5% above the five year average for this time of year. Both finished gasoline and blending components inventories decreased last week. Distillate fuel inventories decreased by 1.3 million barrels last week and are about 2% below the five year average for this time of year.
Note: As of 5:00 pm EDT 11 March 2026
Key data to move markets
EUROPE
Friday: Spanish Harmonised Index of Consumer Prices and Eurozone Industrial Production
Monday: German Bundesbank Monthly Report.
Tuesday: Italian CPI, German ZEW Economic Sentiment and Current Situation surveys, and Eurozone Economic Sentiment Survey.
Wednesday: Eurozone Harmonised Index of Consumer Prices and Core Harmonised Index of Consumer Prices
UK
Thursday: Industrial Production and a speech by BoE Governor Andrew Bailey
Friday: GDP, Manufacturing Production, and Consumer Inflation Expectations
USA
Thursday: Initial and Continuing Jobless Claims, Building Permits, Housing Starts, Monthly Budget Statement, and a speech by Federal Reserve Vice Chair for Supervision Michelle Bowman
Friday: Core Personal Expenditure Price Index, GDP, Core Personal Consumption Expenditures, Personal Income, Personal Spending, Durable Goods Orders, Nondefence Capital Goods Orders, Michigan Consumer Expectations Index, Michigan Consumer Sentiment Index, JOLTS Job Openings, and University of Michigan 1-year and 5-year Consumer Inflation Expectations
Monday: NY Empire State Manufacturing Index and Industrial Production
Tuesday: ADP Employment Change, Retail Sales, and Pending Home Sales
Wednesday: Building Permits, Housing Starts, PPI, Core PPI, Fed Interest Rate Decision, Fed Monetary Policy Statement, FOMC Economic Projections, Interest Rate Projections, and FOMC Press Conference
JAPAN
Tuesday: Exports, Imports, and Adjusted Merchandise Trade Balance
Wednesday: BoJ Interest Rate Decision, and Monetary Policy Statement
CHINA
Sunday: Industrial Production, Retail Sales
Monday: Foreign Direct Investment
While every effort has been made to verify the accuracy of this information, EXT Ltd. (hereafter known as “EXANTE”) cannot accept any responsibility or liability for reliance by any person on this publication or any of the information, opinions, or conclusions contained in this publication. The findings and views expressed in this publication do not necessarily reflect the views of EXANTE. Any action taken upon the information contained in this publication is strictly at your own risk. EXANTE will not be liable for any loss or damage in connection with this publication.
本文提供給您僅供資訊參考之用,不應被視為認購或銷售此處提及任何投資或相關服務的優惠招攬或遊說。金融商品交易涉及重大損失風險,可能不適合所有投資者。過往績效不代表未來表現。


由專業人士建立。為專業人士打造。
