Global market indices
US Stock Indices Price Performance
Nasdaq 100 -6.17% MTD and -6.74% YTD
Dow Jones Industrial Average -5.49% MTD and -2.61% YTD
NYSE -4.88% MTD and -0.24% YTD
S&P 500 -5.97% MTD and -4.80% YTD
The S&P 500 is -4.16% over the past week, with all of the 11 sectors down MTD. The Equally Weighted version of the S&P 500 is -3.09% this week. Its performance is -4.81% MTD and -2.33% YTD.
The S&P 500 Utilities sector is the leading sector so far this month, down -2.68% MTD and +1.27% YTD, while Financials is the weakest at -8.68% MTD and -1.60% YTD.
This week, Energy outperformed within the S&P 500 at +2.57%, followed by Utilities and Industrials at -0.50% and -1.96%, respectively. Conversely, Consumer Discretionary underperformed at -6.30%, followed by Financials and Real Estate, at -5.11% and -4.57%, respectively.
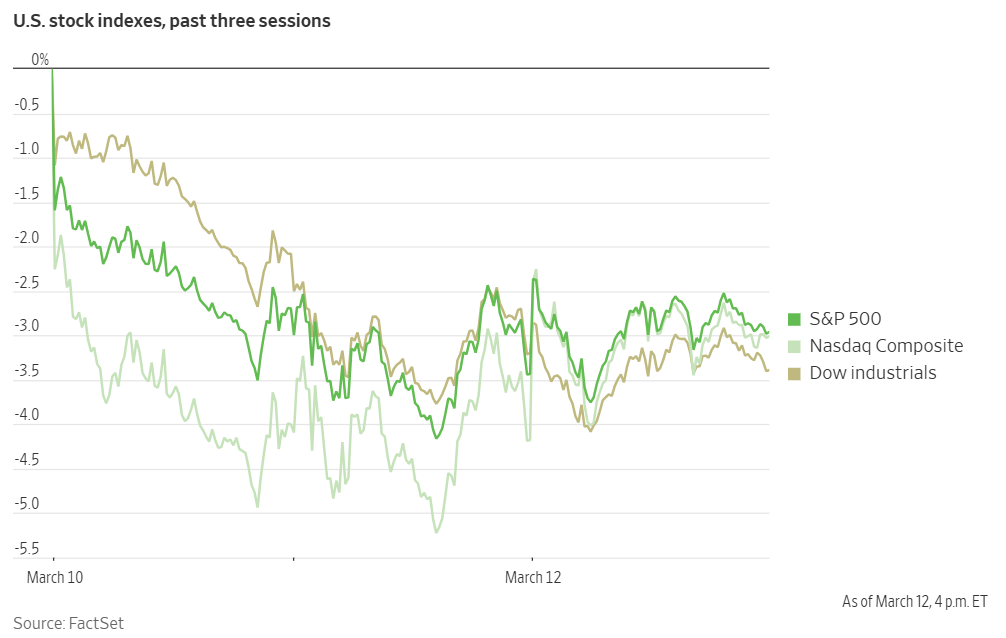
The S&P 500 and Nasdaq rebounded on Wednesday amidst market pressures stemming from global trade tensions and concerns regarding US economic growth.
The positive turn occurred after the release of the February Consumer Price Index (CPI) report. The CPI data was interpreted favourably for risk assets, as it alleviated concerns of inflationary acceleration observed in January. This development provides policymakers with increased flexibility and supports the potential for Fed policy easing should indicators of labour market weakness materialise.
While the Dow Jones Industrial Average seesawed, ultimately closing -0.2%, the Nasdaq Composite had a +1.2% gain. The S&P 500 also reversed earlier losses to close +0.5%, indicating a broader positive sentiment shift in the market.
In corporate news, Intel announced the appointment of a new CEO, resulting in a post-market share price increase exceeding 10%. Furthermore, reports from Reuters indicated that TSMC has approached Nvidia, AMD, and Broadcom regarding potential equity participation in a joint venture to operate Intel's manufacturing facilities. This news spurred a rally in all of their stocks.
Spirit Airlines emerged from Chapter 11 bankruptcy, outlining a plan to continue its evolution and better compete with larger airlines. The budget carrier had filed for bankruptcy in November to address significant debt accumulated after years of financial losses. Spirit's challenges were compounded by the blocked merger with JetBlue, a decision upheld by a federal judge who sided with the Justice Department, and competition that intensified pressure on its no-frills business model. Additionally, engine defects that grounded a portion of its fleet further impacted the airline's financial stability.
Mega caps: The Magnificent Seven had a negative performance this week with Nvidia -1.33%, Alphabet -3.42%, Microsoft -4.43%, Amazon -4.55%, Meta Platforms -5.62%, Apple -7.96%, and Tesla -11.11%.
Energy stocks had a positive performance this week, with the Energy sector itself +2.57%. WTI and Brent prices are +1.45% and +2.34%, respectively this week. Over this past week ConocoPhillips +9.98%, Apa +4.80%, Phillips 66 +3.54%, ExxonMobil +3.50%, Halliburton +2.15%, BP +2.14%, Hess +1.90%, Shell +1.58%, Marathon Petroleum +1.48%, Occidental Petroleum +1.30%, Chevron +1.23%, Energy Fuels +0.84%, and Baker Hughes +0.38%.
Materials and Mining stocks had a mostly negative performance this week, with the Materials sector -3.62%. Sibanye Stillwater +10.28%, Yara International +3.13%, Mosaic +2.32%, and CF Industries +1.83%, while Newmont Corporation -0.50%, Nucor -1.23%, Albemarle -1.89%, and Freeport-McMoRan -3.62%.
European Stock Indices Price Performance
Stoxx 600 -2.86% MTD and +6.63% YTD
DAX +0.55% MTD and +13.90% YTD
CAC 40 -1.51% MTD and +8.24% YTD
IBEX 35 -4.07% MTD and +10.43% YTD
FTSE MIB -2.48% MTD and +10.27% YTD
FTSE 100 -3.05% MTD and +4.50% YTD
This week, the pan-European Stoxx Europe 600 index is -2.67%. It was +0.81% on Wednesday, closing at 541.25.
So far this month in the STOXX Europe 600, Construction & Materials is the leading sector, +1.98% MTD and +11.22% YTD, while Travel & Leisure is the weakest at -8.75% MTD and -7.39% YTD.
This week, Utilities outperformed within the STOXX Europe 600 with a +2.27% gain, followed by Oil & Gas and Autos & Parts at +1.85% and +0.47%, respectively. Conversely, Travel & Leisure underperformed at -6.74%, followed by Health Care and Retail, at -6.05% and -5.82%, respectively.
Germany's DAX index was +1.56% on Wednesday, closing at 22,676.41. It was -1.75% for the week. France's CAC 40 index was +0.59% on Wednesday, closing at 7.988.96. It was -2.26% over the past week.
The UK's FTSE 100 index is -2.45% over the past week to 8,540.97. It was +0.53% on Wednesday.
Within the Stoxx Europe 600 on Wednesday, the Construction & Materials sector emerged as a leading performer, driven by positive earnings reports from Balfour Beatty, which announced a 12% growth in its 2024 order book, reaching £18.4 billion. The company also unveiled plans for a £125 million share buyback in 2025 and projected operational profit growth.
The Industrial Goods & Services sector experienced a boost, particularly within the Defence segment, following the US - Ukraine agreement proposing a 30-day ceasefire, which now awaits the Kremlin's response. Additionally, Rheinmetall reported robust 2024 results, with sales of €9.8 billion, representing a 36% y/o/y increase, and adjusted EBITDA of €1.48 billion. The company further forecast sales growth of 25 - 30% for 2025.
The Chemicals sector also saw gains, supported by better-than-expected earnings reports from Wacker Chemie and Brenntag. The Health Care sector was bolstered by Zealand Pharma's agreement with Roche to co-develop an obesity drug, a deal valued at up to $5.3 billion, which includes an upfront payment of $1.65 billion and potential milestone payments.
Conversely, the Retail sector experienced the most significant decline. Inditex reported a slower start to Q1 2025 sales, prompting analysts to suggest that these soft trading figures could impact the wider sector. Puma also contributed to the sector's decline, reporting a 2025 outlook below market expectations and an adjusted EBIT outlook significantly short of estimates. The Basic Resources sector was negatively impacted by the implementation of US' steel and aluminium tariffs, while the Autos & Parts sector was further weighed down by Porsche's negative FY 2024 earnings. The Travel & Leisure sector underperformed the broader market, following negative announcements from US carriers Delta Air Lines and Southwest Airlines yesterday. In Europe, International Consolidated Airlines Group and Deutsche Lufthansa experienced ratings downgrades from Barclays.
Other Global Stock Indices Price Performance
MSCI World Index -4.79% MTD and -2.28% YTD
Hang Seng +2.87% MTD and +17.65% YTD
This week, the Hang Seng Index was +0.03%, while the MSCI World Index was -4.09%.
Currencies
EUR +4.94% MTD and +5.16% YTD to $1.0888.
GBP +3.07% MTD and +3.63% YTD to $1.2963.
The euro was +0.90% against the USD over the past week, while the British pound was +0.56% against the dollar. The Dollar Index is -0.66% so far this week and -4.53% YTD.
On Wednesday, the US dollar experienced a modest rise against major currencies, including the yen and the euro. The dollar index registered a +0.17% increase on Wednesday to 103.58, poised to conclude a seven-session streak of losses. This movement occurred despite data indicating a deceleration in inflation, as market participants remained apprehensive about the potential inflationary repercussions of the White House's tariff policies.
The prevailing uncertainty among investors stems from the ongoing trade tensions between the US and its trading partners, exacerbated by the US President's unpredictable pronouncements on tariffs. In the latest episode of the tariffs saga, the US President pledged to respond to the EU's threat of imposing counter-tariffs on €26 billion worth of US imports, a reaction to the US implementation of tariffs on steel and aluminium imports.
The euro, after peaking at a five-month high of $1.0947 on Tuesday, subsequently declined by -0.22% to $1.0888 on Wednesday. Ukraine expressed readiness to back a US proposal for a 30-day ceasefire with Russia. Despite the day's decline, the euro has accrued a +4.94% gain against the US dollar in March.
Sterling maintained a relatively stable position against the dollar on Wednesday after reaching $1.29655 on Tuesday’s session, its highest level since 8th November. It increased +0.10% to $1.2963 on Wednesday. Sterling has increased +3.07% so far in March. Conversely, sterling has underperformed against the euro, which has been bolstered by Germany's fiscal paradigm shift and the consequent rise in bund yields. On Wednesday’s session the euro remained largely unchanged at 84.325 pence.
The Bank of Canada (BoC) reduced its key policy rate by 25 basis points to 2.75%, simultaneously issuing a warning regarding a potential new crisis arising from the economic impact of US tariffs. On Tuesday, the US President reversed a pledge to double tariffs on steel and aluminium imports from Canada to 50%, a decision that followed a reciprocal retraction of electricity surcharge plans by the Ontario Premier. The US dollar weakened against the Canadian dollar, falling by -0.42% to C$1.4372 on Wednesday, representing a -0.64% decline for March.
On Wednesday, the dollar strengthened by +0.28% against the Japanese yen, reaching ¥148.22. However, the dollar has depreciated by -0.40% against the yen over the past week and by -1.58% thus far this month.
Note: As of 5:00 pm EST 12 March 2025
Cryptocurrencies
Bitcoin -1.63% MTD and -10.98% YTD to $83,124.56.
Ethereum -15.13% MTD and -43.14% YTD to $1,897.21.
Bitcoin is -8.12% and Ethereum -15.24% over the past week. On Wednesday Bitcoin was -0.13% and Ethereum -2.55%. Cryptocurrencies, like equity markets, have been hit this week by the fears raised by the rapidly changing macro environment as global trade frictions increased resulting in a slowdown in capital flows. The surprise is that cryptocurrencies are declining despite a 6 March executive order that the US would be forming both a Strategic Bitcoin Reserve and a national Digital Asset Stock. However, the order stated that the government will retain any of the cryptocurrency that comes into its possession via asset seizure or forfeitures, rather than sell it. This was a huge disappointment to market participants who may have been expecting regular purchases at fair market value. This would be supportive not just to Bitcoin but to the other smaller coins suggested in the reserve. And in a further blow to investors is that It is still not clear whether the reserve will ever be implemented as there may be legal or political barriers that prevent it from being realised as defined by the executive order. Investors will continue to look for other positive signs in the macroeconomy such as drops in inflation which would increase the likelihood of Fed rate cuts, thereby increasing liquidity and making risk assets such as cryptocurrencies more attractive.
Note: As of 5:00 pm EST 12 March 2025
Fixed Income
US 10-year yield +9.5 bps MTD and -26.1 bps YTD to 4.315%.
German 10-year yield +47.1 bps MTD and +51.3 bps YTD to 2.882%.
UK 10-year yield +19.6 bps MTD and +11.3 bps YTD to 4.681%.
US Treasury 10-year bond yields are +3.4 bps over the past week. Longer-dated US Treasury yields were higher on Wednesday.
The yield on the US 10-year Treasury note ended the trading session on Wednesday +3.0 bps to 4.315%. US Treasury yields experienced an increase on Wednesday, driven by concerns regarding the potential inflationary effects of a global trade conflict. This upward pressure countered the optimism generated by the moderation in the CPI data for February.The Bureau of Labor statistics reported Wednesday that the CPI rose 2.8% y/o/y in February. This was less than the 2.9% gain economists anticipated and lower than January’s 3.0%. CPI was +0.2% m/o/m, following January’s +0.5% rise. Core CPI, which excludes the volatile food and energy components, was +3.1% from year-ago levels after rising 3.3% in January. On a m/o/m basis core cpi was +0.2% in February, a reduction from January’s +0.4% gain. However, the underlying components of the CPI, which are incorporated into the personal consumption expenditures (PCE) index—the Fed's preferred measure of inflation—exceeded expectations.
The PPI report for February, scheduled for release today, will be closely scrutinised for its implications on the PCE, which is slated for publication on 28th March.
On the short end of the curve, the yield on the 2-year Treasury note fell -2.2 bps this week to 3.991%. It was +5.0 bps on Wednesday. On the longer end of the curve, the 30-year yield was +9.3 bps higher on the week and settled at 3.165%, after rising +5.8 bps on Wednesday.
The Treasury Department's auction of $39 billion in 10-year notes on Wednesday demonstrated robust demand. The notes were sold at a high yield of 4.310%, slightly below pre-auction trading levels. The bid-to-cover ratio reached 2.59x, the highest recorded since December. This sale followed the Treasury's auction of $58 billion in three-year notes on Tuesday, and will be followed by a $22 billion auction of 30-year bonds today.
The probability for a Fed 25-bps rate reduction by CME Group's FedWatch Tool at its 7th May meeting decreased from 37.4% last week to 27.4% on Wednesday. Traders are currently pricing in 69.9 bps of cuts by the Fed this year, from projections of 71.0 bps last week.
German Bund yields reached a 17-month high on Wednesday before subsequently moderating. This fluctuation occurred as Germany's prospective chancellor sought to garner support for a substantial increase in state borrowing, intended to revitalise the economy and augment military expenditures.
The timeline for securing legislative approval within the current parliamentary session is limited. While Friedrich Merz endeavors to persuade lawmakers, a co-leader of the Green Party has remained non-committal regarding the feasibility of reaching an agreement.
Germany's 10-year government bond yields ended the day -1.4 bps at 2.882%, having previously peaked at a 7.0 basis point increase, the highest since October 2023. These yields experienced a significant surge of 44.7 bps last week, marking their most substantial weekly rise since February 1990.
Germany's two-year bond yield, which is particularly sensitive to anticipated ECB rate expectations, was -1.4 bps this week at 2.224%. On the longer end of the curve, Germany's 30-year yield was up +9.3 bps this week to 3.165%.
Market participants appeared to mitigate concerns regarding the potential adverse effects of US tariffs on the economy, and the possibility of the ECB implementing accommodative monetary policies, which would typically drive borrowing costs lower.
Traders are now pricing in an ECB deposit facility rate of 2.07% for December, up from 1.92% the previous week, prior to the announcement of Germany's fiscal plans. They are also factoring in approximately a 50% probability of a 25 bps rate cut in April.
The spread between US 10-year Treasuries and German Bunds is now 143.3 bps, 5.7 bps lower than 149.0 bps last week.
Italian bond yields, a benchmark for the eurozone periphery, were +8.2 bps this week to 3.998%. Consequently, the yield spread between Italian and German bonds narrowed slightly by -0.9 bps to 111.6 bps from 112.5 bps last week. Italy's 10-year bond yield was -1.5 bps on Wednesday. The spread between French and German 10-year bond yields was 2.6 bps wider this week, reaching 68.3 bps from 65.7 bps last week.
The UK 10-year yield was +3.3 bps over the past 7 days, on Wednesday 10-year British gilt yields were +5.1 bps and reached 4.681%
Financial market stress: corporate bond spreads reflect global trade and recession concerns. This week, the yield spreads between corporate bonds and US Treasuries reached their widest point since September, indicating increasing investor apprehension regarding a potential recession and a global trade conflict.
Specifically, US investment-grade bond spreads reached 94 bps on Tuesday, their highest level since 18th September, as reported by the ICE BofA Corporate Index. Similarly, junk bond spreads widened to 322 bps, also the widest since 18th September, according to the latest update of the ICE BofA High Yield Bond Index.
Investors consider US corporate bond spreads, particularly the differential between yields on bonds issued by companies with lower credit ratings and the comparatively risk-free US government debt, to be a reliable indicator of financial market stress.
The expansion of these spreads serves as a further indication of heightened concern regarding the economic outlook, following the implementation of import tariffs by the US administration, which has raised the prospect of a global trade war.
JPMorgan analysts observed on Wednesday that the junk bond spread has increased by 59 bps since its recent low on 18th February. They further projected that junk bond spreads are ‘biased wider’ in the coming months, attributed to the ‘vast macro uncertainty’ surrounding trade policy, inflation, and the possibility of a global recession.
Commodities
Gold spot +2.61% MTD and +11.79% YTD to $2,933.17 per ounce.
Silver spot +7.16% MTD and +15.42% YTD to $33.23 per ounce.
West Texas Intermediate crude -3.23% MTD and -8.50% YTD to $67.69 a barrel.
Brent crude -2.87% MTD and -5.00% YTD to $70.98 a barrel.
Gold prices are +0.51% this week. On Wednesday, gold, considered a safe-haven asset, was up with spot gold rising +0.59%, reaching $2,933.17 per ounce. Concurrently, US gold futures settled +0.90% higher, at $2,946.80.
This upward movement was attributed to the prevailing uncertainties surrounding tariff policies and February’s CPI which indicated a moderation in inflation, increasing market expectations of Fed rate cuts.
Market participants are now focusing on the forthcoming release of the US PPI and weekly jobless claims data, scheduled for later today.
This week, WTI and Brent are +1.45% and +2.34%, respectively.
On Wednesday, oil prices experienced a notable increase, exceeding one and a half percentage points, driven by US government data indicating tighter-than-anticipated oil and fuel inventories. Market participants continued to express concerns about a potential slowdown in the US economy and the impact of tariffs on global growth.
Brent crude futures settled at $70.98 per barrel, marking a $1.08, or +1.55%, increase. WTI crude futures rose by $1.07, or +1.61%, to $67.69 per barrel.
The stronger-than-anticipated demand implied by the latest inventory data - a smaller build in oil stocks and larger draws in gasoline and diesel inventories than expected - could provide support for oil prices.
In recent trading sessions, crude futures have benefited from a weakening US dollar and the Energy Information Administration's (EIA) revised outlook, which shifted away from previous projections of significant oil market oversupply in 2025. The US dollar remained near a five-month low against major currencies as traders assessed the implications of tit-for-tat US - EU tariffs and a potential Russia-Ukraine ceasefire. The dollar index declined by -0.17% to new 2025 lows on Tuesday, making crude less expensive for buyers holding other currencies.
Despite signs of moderating inflation, indicated by the US CPI data for February, concerns persist regarding the inflationary effects of the White House's tariff policies. The tariffs, which have either been implemented or are scheduled to be implemented, are anticipated to increase the cost of goods and result in lower growth.
Additionally, OPEC maintained its forecast for solid global oil demand growth in 2025, attributing this outlook to anticipated increases in air and road travel. OPEC also reported a 363,000 barrel-per-day increase in OPEC+ production during February, primarily driven by a surge in output from Kazakhstan, which has been lagging in its adherence to OPEC+ production quotas.
EIA weekly: petroleum stockpiles shift during seasonal refinery adjustments. According to the EIA, US crude oil stockpiles increased while fuel inventories decreased during the past week, coinciding with ongoing seasonal refinery maintenance. Crude inventories saw a rise of 1.4 million barrels, reaching 435.2 million barrels in the week ending 7th March. Crude stocks at the Cushing, Oklahoma, delivery hub experienced a decline of 1.2 million barrels.
Crude inventories within the Strategic Petroleum Reserve (SPR) reached their highest level since 2022. The US government has expressed its intent to replenish the SPR to its maximum capacity, a process that could span several years and entail a $20 billion investment.
Refinery crude runs demonstrated an increase of 321,000 bpd. Consequently, refinery utilisation rates, which have remained around 85% since mid-January, rose by 0.6 percentage points to 86.5%.
In terms of fuel inventories, gasoline stocks decreased by 5.7 million barrels, totaling 241.1 million barrels. Similarly, distillate stockpiles, encompassing diesel and heating oil, fell by 1.6 million barrels, settling at 117.6 million barrels.
Finally, net US crude imports increased by 503,000 bpd, reaching 2.18 million bpd. While this represents an increase, it remains below the YTD average of 2.24 million bpd.
Note: As of 5:00 pm EST 12 March 2025
Key data to move markets
EUROPE
Thursday: Industrial Production and a speech by ECB Vice President Luis de Guindos.
Friday: German Harmonised Index of Consumer Prices and CPI, French CPI, Spanish Harmonised Index of Consumer Prices, and a speech by ECB Executive Board member Piero Cipollone.
Monday: Italian CPI and Bundesbank Monthly Report.
Tuesday: German ZEW Surveys on Current Situation and Economic Sentiment and Eurozone ZEW Survey on Economic Sentiment.
Wednesday: Eurozone Harmonised Index of Consumer Prices, Core Harmonised Index of Consumer Prices, and EU leaders summit.
UK
Friday: GDP, Industrial and Manufacturing Production, and Consumer Inflation Expectations.
Monday: BoE Quarterly Bulletin.
US
Thursday: Initial and Continuing Jobless Claims, PPI, and Core PPI.
Friday: Michigan Consumer Sentiment Index and UoM 5-year Consumer Inflation Expectation.
Monday: Retail Sales and NY Empire State Manufacturing Index.
Tuesday: Building Permits, Housing Starts, and Industrial Production.
Wednesday: Fed Interest Rate Decision, Fed Monetary Policy Statement, FOMC Economic Projections, and FOMC Press Conference.
CHINA
Sunday: Industrial Production and Retail Sales.
Wednesday: PBoC Interest Rate Decision.
JAPAN
Tuesday: Trade Balance, Imports and Exports.
Wednesday: BoJ Interest Rate Decision, Monetary Policy Statement and Press Conference.
Global Macro Updates
Trump’s ratcheting trade war. After US President Donald Trump imposed 25% tariffs on steel and aluminium against the EU which came into force on Wednesday, European Commission president Ursula von der Leyen said the EU regretted Trump’s decision and that tariffs were “bad for business, and even worse for consumers”. Trump then said he would respond to the EU’s countermeasures, raising the risk of further escalation in his global trade war.
This back and forth on tariffs has hit investor confidence and led to a drop in both consumer and business confidence. With expectations that a tariff war will result in slower growth, equity markets have been down, with the S&P 500 in particular shifting into almost into contractionary territory. The longer this volatility and the resulting downward pressure continues, the more worried we will see investors about possible “negative wealth effects”. In essence Trump’s policy uncertainty would create a negative feedback loop, compounding growth fears.
Adding to DC uncertainty (or Trump 2.0 headwinds), on Tuesday night, in an attempt to avert a potential government shutdown following the 14th March deadline, the US House of Representatives passed a continuing resolution (CR), authorising spending through the fiscal year's end on 30th September. The vote, 217-213, saw near-unanimous Republican support, including from many Freedom Caucus members who have historically opposed funding bills, as reported by Politico. This legislation increases certain defence expenditures while reducing non-defence outlays, and grants the White House greater flexibility in spending decisions.
The bill now proceeds to the Senate, where it initially encountered opposition from Democratic leadership, according to Bloomberg. However, by Wednesday evening, indications emerged that a compromise to prevent a shutdown was within reach. Senate Majority Leader John Thune expressed openness to allowing Democrats a vote on a short-term spending measure, contingent on their consent to all final votes on the House measure, known as continuing resolution, before the deadline. Achieving the necessary 60-vote threshold to overcome a filibuster necessitates some Democratic support. Nevertheless, concerns persist among several Democratic senators, who fear being perceived as capitulating to the White House and endorsing the President's spending reduction initiatives.
The US seems to be slowing down. Is it temporary? Preliminary data for Q1, though limited to the early part of the year, indicate a decisive contraction in US GDP. While acknowledging potential temporary influences, these initial figures also raise some concerning underlying trends.
Despite the new tariffs only just beginning this month, and with potential for further delays, US imports and the trade deficit have already been on the rise since November. This surge intensified in January, significantly dragging down estimates for Q1 GDP. This import activity appears to be driven by businesses pulling in materials and goods to get ahead of the impending tariffs, a trend that could reverse course by the second quarter of 2025.
Inflation experienced a sharp increase in January for the fourth consecutive year. While seasonal ‘turn of the year’ factors seem to be at play, suggesting a likely moderation in February, the uncertainty surrounding the precise scope and scale of the incoming US tariffs remains a concern. Given that these tariff threats are considerably larger than those seen in 2018, a more pronounced impact on consumer prices is anticipated by Q2 2025.
Tariffs, ultimately paid by importers and consumers, do not contribute to increased US household income. In addition, US employment growth, though still positive, is slowing. Should this positive employment trend reverse before domestic investment and production can adequately rise to compensate for the difficulty these tariffs impose, the costs associated with these tariffs will be more keenly felt. The balance between growth and inflation will face considerable headwinds.
Late last year, US business confidence experienced a surge, driven by expectations of regulatory easing and tax reductions. In his recent Congressional address, the US President outlined various governmental initiatives intended to reshape the US economy, which carry potential for both positive and negative long-term consequences. However, since the end of 2024, consumer confidence has exhibited a marked decline. It is anticipated that forthcoming business sentiment indicators might reflect a similar trend.
The Federal Reserve Bank of Atlanta's daily GDPNow tracking estimate for Q1 real GDP growth indicates a contraction of 2.4%. The figure fluctuates daily as new inputs are released and data are revised. What factors are contributing to the Atlanta Fed's prediction of the most significant US economic decline since the 2020 pandemic? A significant increase in US imports since the presidential election, to avoid upcoming tariffs. This constitutes a source of global trade volatility and distortions that is unlikely to last. The nominal US trade deficit expanded at an annualised rate of $400 billion in January, and the 10% surge in US imports during the same month marked the second largest in recorded history.
Is the rise in imports a sign of US demand strength as might typically be the case? In the same month, US real consumer spending fell 0.5% (non-annualised). If this figure holds unrevised, it would represent the most substantial decline in unit consumer demand since February 2021, when the pandemic still raged.
This discrepancy highlights the potentially misleading nature of GDP data. With consumption declining while imports rise, the question becomes: what is absorbing this economic ‘slack’? While reported with a delay, a sharp increase in US inventories is likely. Accountingly, this inventory build-up will offset a portion of the import surge, artificially boosting the US growth metric in a way that current Q1 GDP tracking estimates do not yet fully reflect. Nevertheless, unless a genuine rebound in US domestic demand materialises, a weakening in both trade and domestic production is anticipated for Q2 2025.
While every effort has been made to verify the accuracy of this information, EXT Ltd. (hereafter known as “EXANTE”) cannot accept any responsibility or liability for reliance by any person on this publication or any of the information, opinions, or conclusions contained in this publication. The findings and views expressed in this publication do not necessarily reflect the views of EXANTE. Any action taken upon the information contained in this publication is strictly at your own risk. EXANTE will not be liable for any loss or damage in connection with this publication.
Ця стаття надається вам лише для інформаційних цілей і не повинна розглядатися як пропозиція або запит на купівлю або продаж будь-яких інвестицій або пов'язаних послуг, які можуть бути згадані тут. Торгівля фінансовими інструментами пов'язана зі значним ризиком втрат і може підходити не всім інвесторам. Минулі результати не є надійним показником майбутньої ефективності.